Download
1 / 10
120 likes | 336 Views
Velocity-Time Graphs. Velocity-Time Graphs. Velocity-time graphs are graphs that represent an object’s velocity versus its time. Time is marked on the horizontal axis and velocity is on the vertical. Like position-time graphs, velocity-time graphs are drawn with a line of best fit.

E N D
Velocity-Time Graphs • Velocity-time graphs are graphs that represent an object’s velocity versus its time. • Time is marked on the horizontal axis and velocity is on the vertical. • Like position-time graphs, velocity-time graphs are drawn with a line of best fit. • Velocity-time graphs are usually idealized, this means the details of speeding up and slowing down are not important. In the real world the graphs would be more rounded on the corners.
Be careful! • Velocity-time graphs do not show an object’s position. • Positive and negative signs show the object’s direction of motion as it appears to an observer.
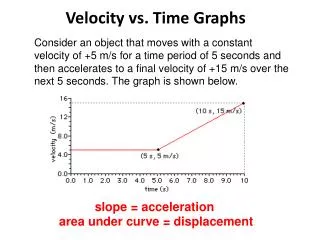
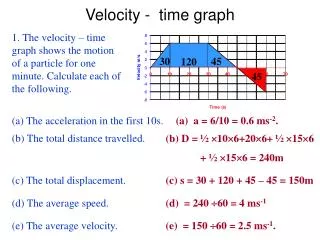
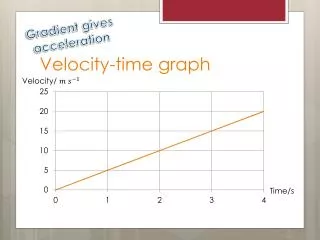
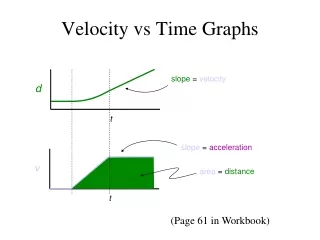
Interpreting Velocity-Time graphs • Horizontal lines show uniform motion (constant speed and direction). • Inclined lines show change in speed or direction, or both: in other words accelerated motion. Velocity-time graphs can be tricky to interpret so lets look at a few examples:
Example A: • The car was travelling forward at a steady speed of 50 km/h. Then it slowed down to 30km/h as it entered a school zone and continued until the end of the observations.
Example B • The car was travelling forward at a steady speed of 30 km/h. It came to a stop, and stayed stopped for a period before it resumed its motion forward again.
Example C • The car was at rest, then quickly moved backwards at a speed of 10 km/h. The car then moved forward, speeding up until reaching a constant speed of 40 km/h.
Practice: • Do the following text questions: • Pg 329 #4 • Pg 348 #2,3 • Pg 350 #6,8,12 Review: • Pg 414 T/F 1-5, MC # 14, 15, 16, 17 • Pg 415 #22,24,25,