Download
1 / 21
210 likes | 325 Views
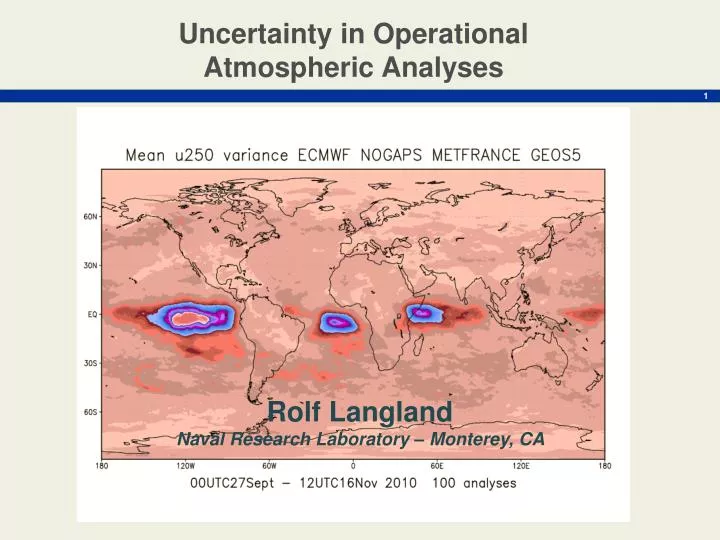
Uncertainty in Operational Atmospheric Analyses . Rolf Langland Naval Research Laboratory – Monterey, CA . Objectives . Quantify the uncertainty ( differences ) in current operational analyses of the atmosphere – height, temperature, winds

E N D
Uncertainty in Operational Atmospheric Analyses Rolf Langland Naval Research Laboratory – Monterey, CA
Objectives Quantify the uncertainty (differences) in current operational analysesof the atmosphere – height, temperature, winds Consider implications of analysis uncertainty for NWP and plans for the future global observing network Analysis differences are a proxy for actual analysis error, which cannot be precisely quantified
Significance of Analysis Uncertainty/Error • Quality of NWP forecasts from short to medium-range • Extended-range NWP? • Short-range climate forecasts? • Quality of forecast verification • Accuracy of climate monitoring
Causes of Analysis Differences and Error • Gaps/deficiencies in global observing network • Errors /bias in observation data • Choices in observation selection • Observation quality control decisions • Different and imperfect data assimilation techniques • Errors in background forecast
Methodology • Use multi-year, multi-model archive of operational analyses and forecasts, developed at NRL for research and diagnostic studies • Quantify and examine differences in atmospheric analyses, trends over time … • Examine systematic (monthly/seasonal) patterns
Surprisingly sparse literature on the topic of atmospheric analysis uncertainty and error “Some aspects of the improvement in skill of numerical weather prediction, 2002: A.J. Simmons and A. Hollingsworth, QJRMS. Langland, Maue, Bishop, 2008: Tellus “Analysis differences and error variance estimates from multi-centre analysis data,” 2010: M. Wei, Z. Toth, Y. Zhu, Aust. Met. and Ocean Journal. Dec 2011 – WGNE presentation by Tom Hamill
Analyses from NCEP, ECWMF, UKMO, CMC, FNMOC 00UTC: 1Feb 2008 to 30Apr 2008 Wei et al. (2010) Time-averaged spread over the average anomaly In general, smaller analysis spread in locations with in-situ observations (esp. raodiosondes, aircraft)
Analyses from NCEP, CMC, FNMOC 00UTC, 12UTC: 1Jan 2007 to 1Jun 2007 Langland et al. (2008) 500mb Temperature Analyses Root Mean Square Difference (CMC / AVN) Radiosonde observation count • [RMS difference, K] • [proxy for analysis uncertainty] • [Number of observations in 2° x 2° boxes] Indication that assimilation of high-quality in-situ observations (radiosondes, aircraft data) reduces analysis uncertainty more than assimilation of satellite observations (radiances and feature-track or scatterometer winds)
500mb Temperature Analyses Root Mean Square Difference 1 Jan – 1 Jun 2007 Langland et al. (2008) NOGAPS / AVN NOGAPS / CMC • [RMS difference, K] • [RMS difference, K] Smaller analysis uncertainty (<1K) where radiosonde data are provided Larger uncertainty (1-2K) between analyses where satellite data predominates • UNCERTAINTY BETWEEN ANALYSES CAN BE LARGER THAN SHORT-RANGE “FORECAST ERROR” !!
2011: same pattern still in place! [Many new radiance data have been added during 2007-2011] Root-Mean Square of Analysis Differences: 500mb Temperature EUCOS K Langland and Maue 2011
Analyses from NCEP, ECWMF, UKMO, CMC, CMA 00UTC: 1OCT 2010 to 30Sep 2011 Hamill (WGNE, Dec 2011) 250 hPa u-wind 500 hPa height ms-1 Time-average of daily spread (sample standard deviation) of analyses about their daily mean “Analyses, assumed to be unbiased, do exhibit substantial bias Implications for ensemble perturbations (may be too small)”
300mb Wind Speed (2010) GFS / ECMWF Root-Mean Square of Analysis Differences: 300mb Wind Speed Langland and Maue 2011 2010 Note the very significant effect of in-situ wind observations: Radiosondes and Commercial Aircraft 2009 2011 2008 ms-1
Radiosonde stations on the budget chopping block Example: Eareckson Air Station (Shemya) 70414 Langland and Maue 2011 GFS | ECMWF Root mean square difference of analyzed 300mb wind speed: July 2009 – June 2011 Shemya Island March 2012: NRL received a message from NUOPC (National Unified Operational Prediction Capability), that NOAA was trying to convince USAF not to end soundings at station 70414. Previously in 2008, soundings were reduced to one per-day (12UTC). This station is in top 10% world-wide for error reduction (NRL study). 70414 ms-1 Unicertaintyin atmospheric upper-tropospheric wind analyses is substantially lower in locations where radiosonde data is provided. The blue-shaded areas are locations where raobs provide soundings twice-daily (00z and 12z). Station 70414 provides data only at 12z, so the associated reduction in analysis error at that location is mitigated, but still significant.
Question Why is analysis uncertainty over oceanic regions still much larger than over North America and Europe, despite the addition of massive amounts of radiance data? [Now as much as 90% of all assimilated data.] Basic patterns of analysis differences and analysis uncertainty in 2012 remain similar to those reported in 2002
Summary Assimilation of radiosonde and aircraft data substantially reduces uncertainty in upper-air analyses of temperature and wind Analysis uncertainty is larger where analyses relies primarily on radiance observations What new observing instruments and variables are most-needed to reduce analysis uncertainty? Where is the greatest need to reduce the current magnitude of analysis uncertainty? Polar regions? Oceanic storm tracks? Targeted improvements to observing system and data assimilation procedures?
About 19 million observations assimilated in global domain each day in NAVDAS-AR [4d-Var] 28 Apr 2012 [00, 06, 12, 18 UTC] HIGH OBSERVATION DENSITY DOES NOT GAURANTEE ANALYSIS QUALITY !! Data count in 2° x 2° lat/lon bins
Count of observations assimilated by NAVDAS-AR 28 Apr 2012 [00, 06, 12, 18 UTC] Data count in 2° x 2° lat/lon bins The largest density of observations is due to in-situ data [radiosondes, aircraft, land-surface and ocean-surface observations]