Download
1 / 25
250 likes | 281 Views
Explore the debate between fixed and random effects models in an education context for evaluating factors such as SEN and school size on student achievement. Learn when to choose each model and understand their implications.

E N D
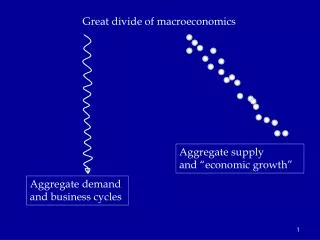
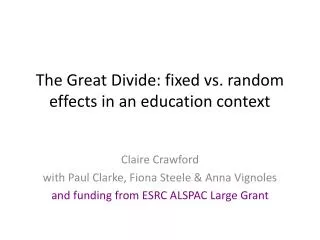
The Great Divide: fixed vs. random effects in an education context Claire Crawford with Paul Clarke, Fiona Steele & Anna Vignoles and funding from ESRC ALSPAC Large Grant
Introduction I • Our strand concerned with determinants of educational achievement • Number of substantive research questions: • Impact of SEN • Impact of school size • Joint determination of cognitive and non-cognitive skills (ECM agenda)
Introduction II • Thinking about appropriate models • Pupils clustered within schools → hierarchical models • Two popular choices: fixed and random effects • Which approach is best in which context? • Idea is always to move closer to a causal interpretation • Choice of model: • Often driven by discipline tradition • May depend on whether primary interest is pupil or school characteristics
Outline of talk • Why SEN? • Fixed and random effects models in the context of our empirical question • Data and results • Tentative conclusions
Introduction to SEN • One in four Y6 pupils in England identified as SEN • With statement (more severe): 3.7% • Without statement (less severe): 22.3% • SEN label means different things in different schools and for different pupils • Maximum means special school or full time teaching assistant (i.e. additional resources) • Minimum means close monitoring or annual review • Recognition that SEN is not a “treatment”
Why adjust for school effects? • Want to estimate causal effect of SEN on pupil attainment no matter what school they attend • Need to adjust for school differences in SEN labelling • e.g. children with moderate difficulties more likely to be labelled SEN in a high achieving school than in a low achieving school (Keslair et al, 2008; Ofsted, 2004) • May also be differences due to unobserved factors • Hierarchical models can account for such differences • Fixed or random school effects?
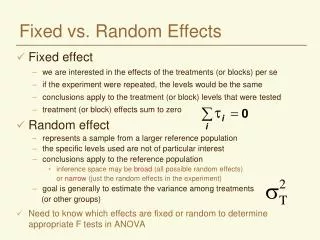
Fixed effects vs. random effects • Long debate: • Economists tend to use FE models • Educationalists tend to use RE/multi-level models • But choice must be context and data specific
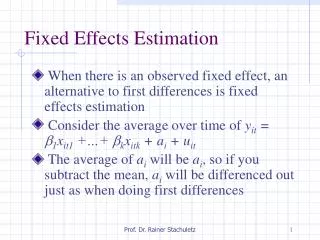
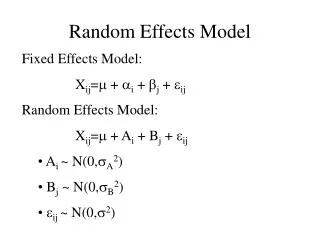
Basic model • FE: us is school dummy variable coefficient • RE: us is school level residual • Additional assumption required: E [us|Xis] = 0 • That is, no correlation between unobserved school characteristics and observed pupil characteristics • Both: both models assume: E [eis|Xis] = 0 • That is, no correlation between unobserved pupil characteristics and observed pupil characteristics
Relationship between FE, RE and OLS FE: RE: Where:
How to choose between FE and RE • Very important to consider sources of bias: • Is RE assumption (i.e. E [us|Xis] = 0) likely to hold? • Other issues: • Number of clusters • Sample size within clusters • Rich vs. sparse covariates • Whether variation is within or between clusters • What is the real world consequence of choosing the wrong model?
Sources of selection • Probability of being SEN may depend on: • Observed school characteristics • e.g. ability distribution, FSM distribution • Unobserved school characteristics • e.g. values/motivation of SEN coordinator • Observed pupil characteristics • e.g. prior ability, FSM status • Unobserved pupil characteristics • e.g. education values and/or motivation of parents
Intuition I • If probability of being labelled SEN depends ONLY on observed school characteristics: • e.g. schools with high FSM/low achieving intake are more or less likely to label a child SEN • Random effects appropriate as RE assumption holds (i.e. unobserved school effects are not correlated with probability of being SEN)
Intuition 2 • If probability of being labelled SEN also depends on unobserved school characteristics: • e.g. SEN coordinate tries to label as many kids SEN as possible, because they attract additional resources; • Random effects inappropriate as RE assumption fails (i.e. unobserved school effects are correlated with probability of being SEN) • FE accounts for these unobserved school characteristics, so is more appropriate • Identifies impact of SEN on attainment within schools rather than between schools
Intuition 3 • If probability of being labelled SEN depends on unobserved pupil/parent characteristics: • e.g. some parents may push harder for the label and accompanying additional resources; • alternatively, some parents may not countenance the idea of their kid being labelled SEN • Neither FE nor RE will address the endogeneity problem: • Need to resort to other methods, e.g. IV
Other considerations • RE model may be favoured over FE where: • Number of clusters is large • e.g. ALSPAC vs. NPD • Most variation is between clusters • e.g. UK (between) vs. Sweden (within) • Have rich covariates
Can tests help? • Hausman test: • Commonly used to test the RE assumption • i.e. E [us|Xis] = 0 • But really testing for differences between FE and RE coefficients • Over-interpretation, as coefficients could be different due to other forms of model misspecification and sample size considerations (Fielding, 2004) • Test also assumes: E [πis|Xis] = 0
Data • Avon Longitudinal Study of Parents and Children (ALSPAC) • Recruited pregnant women in Avon with due dates between April 1991 and December 1992 • Followed these mothers and their children over time, collecting a wealth of information: • Family background (including education, income, etc) • Medical and genetic information • Clinic testing of cognitive and non-cognitive skills • Linked to National Pupil Database
Looking at SEN in ALSPAC • Why is ALSPAC good for looking at this issue? • Availability of many usually unobserved individual and school characteristics: • e.g. enjoyment of school, education values of parents, headteacher tenure • In particular: • IQ (measured by clinicians) • Good measures of non-cognitive skills (including behavioural difficulties) reported by parents/teachers
Descriptive statistics • 18% of sample are SEN at age 10 Notes: relationship between selected individual and school characteristics and SEN status. Omitted categories are: mum’s highest qualification is CSE level; head teacher tenure < 1 year.
Impact of SEN: full model • OLS, RE and FE don’t give qualitatively different answers to question of impact of SEN on KS2 APS • Hausman test suggests no difference between FE and RE Note: model also controls for vast array of other individual and school characteristics (where appropriate).
Impact of SEN: NPD only Note: model also controls for limited other individual and school characteristics (where appropriate). • Again OLS, RE and FE don’t give qualitatively different coefficients on SEN • But global Hausman test suggests FE and RE are NOT equivalent • May be because there is correlation between SEN and unobserved individual characteristics? • SEN coefficients about 0.1 SDs higher than in full model
Impact of SEN: girls only • Despite halving sample size, OLS, RE and FE again don’t give qualitatively different coefficients on SEN • But Hausman test suggests FE and RE are NOT equivalent Note: model also controls for vast array of other individual and school characteristics (where appropriate).
Summary • SEN appears to be strongly negatively with progress between KS1 and KS2 • SEN pupils score around 0.5 SDs lower • Choice of model does not seem to matter here • OLS, FE and RE all give qualitatively similar results • Suggests correlation between probability of being SEN and unobserved school characteristics is not important • But doesn’t mean we don’t have to worry about selection on unobserved individual characteristics
Still to come . . . • More detailed investigation of conditions under which FE and RE are equivalent • Simulation study • Do effects of SEN differ across schools?
Tentative conclusions • Approach each problem with agnostic view on model • Should be determined by theory and data, not tradition • In reality, choice may not make very much difference • Can our results be generalised? • Different questions? Different data? • Worth remembering that neither FE nor RE deals with correlation between observed and unobserved individual characteristics