Download
1 / 17
170 likes | 272 Views
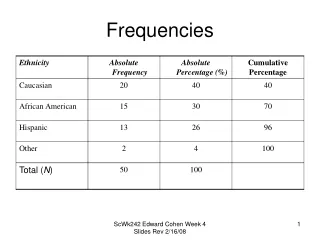
Mean pulse profiles and spectra at the low frequencies. Malov O.I., Malofeev V.M. Pushchino Radio Astronomy Observatory. Observations. LPA : 111. 5 ± 1.5 М Hz, 3.5 m / cos , A ef 3 10 4 cos-55 m 2 Receivers : 128 20 kHz, 32 5 kHz, 128 1.25 kHz

E N D
Mean pulse profiles and spectra at the low frequencies Malov O.I., Malofeev V.M. Pushchino Radio Astronomy Observatory
Observations • LPA: 111.5 ± 1.5 МHz, 3.5 m / cos , Aef 3 104 cos-55 m2 • Receivers: 128 20 kHz, 32 5 kHz, 128 1.25 kHz t = 1.28 ms, 2.56 ms, 5.12 ms for normal PSRs t = 0.3072 ms for millisecond PSRs • Calibration: discrete sources with known flux density step of the noise generator 40 ms for normal PSRs 4 ms for millisecond ones
Receiver requirements • (d/dt)/t – instant bandwidth • scint – decorrelation bandwidth • < DM – dispersion broadening • F – Faraday effect
Data processing • Searching for the “zero” level • Gain equalization • Elimination of channels with interference • Summation of the signal over the channels • Searching for the new “zero” line E = (DCdiagt)t1t2I(t)/NIo D – calibration factor, equal to step amplitude in Jy Cdiag – correction factor taking into account the complex shape of diagram t – sampling interval I and Io – the amplitudes of pulse signal and step in units of ACC t1 and t2 – the boundaries of the summed pulse
Mean profiles at frequency 111 MHz Malov, Malofeev, 2008
Dipole model r/sin2 = rLC - the last open field line (r/rLC)1/2 = (2r/cP)1/2 (r/P)1/2 p2 = nee2/ me p n1/2 r - 3/2 for dipole field r - 2/3 - 1/3 We obtained W - 0.17 c = eB/2mec B r -3 c r - 3 r c- 1/3 (r/rLC)1/2 r1/2 c- 1/6
Conclusions • W - 0.17 probably means that the emission generation takes place at the cyclotron frequency • We constructed spectra for normal and millisecond pulsars using our measurements. About 30% of normal pulsars have a low frequency turn-over. Most of millisecond pulsars (about 95%) have linear spectra