Download
1 / 41
450 likes | 599 Views
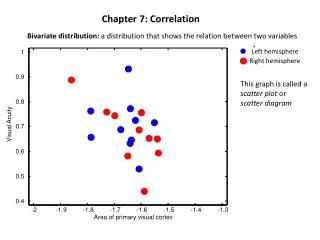
Chapter 7: Scatterplots, Association, & Correlation. AP Statistics Unit 2. Looking at Scatterplots . Scatterplots may be the most common and most effective display for data.

E N D
Chapter 7: Scatterplots, Association, & Correlation AP Statistics Unit 2
Looking at Scatterplots • Scatterplotsmay be the most common and most effective display for data. • In a scatterplot, you can see patterns, trends, relationships, and even the occasional extraordinary value sitting apart from the others. • Scatterplots are the best way to start observing the relationship and the ideal way to picture associationsbetween two quantitative variables.
Looking at Scatterplots (cont.) • When looking at scatterplots, we will look for direction,form, strength, and unusualfeatures. • Direction: • A pattern that runs from the upper left to the lower right is said to have a negativedirection (just like the graph of a line with a negative slope). • A trend running the other way has a positivedirection (just like the graph of a line with a positive slope).
Looking at Scatterplots (cont.) Can the NOAA predict where a hurricane will go? • The figure shows a negative direction between the year since 1970 and the and the prediction errors made by NOAA. • As the years have passed, the predictions have improved (errors have decreased).
Looking at Scatterplots (cont.) • The example in the text shows a negative associationbetween central pressure and maximum wind speed • As the central pressure increases, the maximum wind speed decreases.
Looking at Scatterplots (cont.) • Form: • If there is a straight line (linear) relationship, it will appear as a cloud or swarm of points stretched out in a generally consistent, straight form.
Looking at Scatterplots (cont.) • Form: • If the relationship isn’t straight, but curves gently, while still increasing or decreasing steadily, we can often find ways to make it more nearly straight.
Looking at Scatterplots (cont.) • Form: • If the relationship curves sharply, the methods of this book cannot really help us.
Looking at Scatterplots (cont.) • Strength: • At one extreme, the points appear to follow a single stream (whether straight, curved, or bending all over the place).
Looking at Scatterplots (cont.) • Strength: • At the other extreme, the points appear as a vague cloud with no discernible trend or pattern: • Note: we will quantify the amount of scatter soon.
Looking at Scatterplots (cont.) • Unusual features: • Look for the unexpected. • Often the most interesting thing to see in a scatterplot is the thing you never thought to look for. • One example of such a surprise is an outlierstanding away from the overall pattern of the scatterplot. • Clusters or subgroups should also raise questions.
Roles of variables • It is important to determine which of the two quantitative variables goes on the x-axis and which on the y-axis. • This determination is made based on the roles played by the variables. • When the roles are clear, the explanatoryor predictor variablegoes on the x-axis, and the response variable(variable of interest) goes on the y-axis.
Roles of variables (cont.) • The roles that we choose for variables are more about how we think about them rather than about the variables themselves. • Just placing a variable on the x-axis doesn’t necessarily mean that it explains or predicts anything. And the variable on the y-axis may not respond to it in any way.
Examples What do you expect the scatterplot to look like? Remember direction, form, strength, and unusual features. 1. Drug dosage and degree of pain relief 2. Calories consumed and weight loss
correlation • Data collected from students in Statistics classes included their heights (in inches) and weights (in pounds): • Here we see a positive association and a fairly straight form, although there seems to be a high outlier.
Correlation (cont.) • Note that the underlying linear pattern seems steeper in the standardized plot than in the original scatterplot. • That’s because we made the scales of the axes the same. • Equal scaling gives a neutral way of drawing the scatterplot and a fairer impression of the strength of the association.
Correlation (cont.) • The points in the upper right and lower left (those in green) strengthen the impression of a positive association between height and weight. • The points in the upper left and lower right where zxandzy have opposite signs (those in red) tend to weaken the positive association. • Points with z-scores of zero (those in blue) don’t vote either way, because their product is zero.
Correlation (cont.) • The correlation coefficient (r) gives us a numerical measurement of the strength of the linear relationship between the explanatory and response variables.
Correlation (cont.) • Calculating this by hand can be time consuming and redundant. Below are the steps to calculating it with the use of a calculator: • Make sure your diagnostics are ON (2nd Catalog, scroll to Diagnostics ON Enter) • Store your values into L1 and L2 (x and y respectively) • Stat Calc 8: LinReg(a+bx) • Before pressing Enter, define the lists: L1, L2 Enter
Correlation (cont.) Day 2 • For the students’ heights and weights, the correlation is 0.644. • What does this mean in terms of strength? We’ll address this shortly.
Correlation conditions • Correlationmeasures the strength of the linear association between two quantitative variables. • Before you use correlation, you must check several conditions: • Quantitative Variables Condition • Straight Enough Condition • Outlier Condition
Correlation conditions (cont.) • Quantitative Variables Condition: • Correlation applies only to quantitative variables. • Don’t apply correlation to categorical data camouflaged as quantitative (zip codes, ID #s, area codes, etc.). • Check that you know the variables’ units and what they measure.
Correlation conditions (cont.) • Straight Enough Condition: • You can calculate a correlation coefficient for any pair of variables. • But correlation measures the strength only of the linear association, and will be misleading if the relationship is not linear.
Correlation conditions (cont.) • Outlier Condition: • Outliers can distort the correlation dramatically. • An outlier can make an otherwise small correlation look big or hide a large correlation. • It can even give an otherwise positive association a negative correlation coefficient (and vice versa). • When you see an outlier, it’s often a good idea to report the correlations with and without the point.
Correlation properties • The sign of a correlation coefficient gives the direction of the association. • Correlation is always between –1 and +1. • Correlation can be exactly equal to –1 or +1, but these values are unusual in real data because they mean that all the data points fall exactly on a single straight line. • A correlation near zero corresponds to a weak linear association.
Correlation properties (cont.) • Correlation treats x and y symmetrically: • The correlation of x with y is the same as the correlation of y with x. • Correlation has no units. • Correlation is not affected by changes in the center or scale of either variable. • Correlation depends only on the z-scores, and they are unaffected by changes in center or scale.
Correlation properties (cont.) • Correlation measures the strength of the linear association between the two variables. • Variables can have a strong association but still have a small correlation if the association isn’t linear. • Correlation is sensitive to outliers. A single outlying value can make a small correlation large or make a large one small.
Correlation ≠ Causation • Whenever we have a strong correlation, it is tempting to explain it by imagining that the predictor variable has causedthe response to help. • Scatterplots and correlation coefficients neverprove causation. • A hidden variable that stands behind a relationship and determines it by simultaneously affecting the other two variables is called a lurkingvariable.
Correlation tables • It is common in some fields to compute the correlations between each pair of variables in a collection of variables and arrange these correlations in a table.
Straightening Scatterplots • Straight line relationships are the ones that we can measure with correlation. • When a scatterplot shows a bent form that consistently increases or decreases, we can often straighten the form of the plot by re-expressing one or both variables.
Straightening Scatterplots (cont.) • A scatterplot of f/stop vs. shutter speed shows a bent relationship:
Straightening Scatterplots (cont.) • Re-expressing f/stop vs. shutter speed by squaring the f/stop values straightens the relationship:
Example • Straighten a scatterplot. Try logarithmic and square root re-expressions of US population data.
What can go wrong? • Don’t say “correlation” when you mean “association.” • More often than not, people say correlation when they mean association. • The word “correlation” should be reserved for measuring the strength and direction of the linear relationship between two quantitative variables.
What can go wrong? (cont.) • Be sure the association is linear. • There may be a strong association between two variables that have a nonlinear association.
What can go wrong? (cont.) • Don’t assume the relationship is linear just because the correlation coefficient is high. • Here the correlation is 0.979, but the relationship is actually bent.
What can go wrong? (cont.) • Beware of outliers. • Even a single outlier can dominate the correlation value. • Make sure to check the Outlier Condition.
recap • We examine scatterplots for direction, form, strength, and unusual features. • Although not every relationship is linear, when the scatterplot is straight enough, the correlation coefficient is a useful numerical summary. • The sign of the correlation tells us the direction of the association. • The magnitude of the correlation tells us the strength of a linear association. • Correlation has no units, so shifting or scaling the data, standardizing, or swapping the variables has no effect on the numerical value.
Recap (cont.) • Doing Statistics right means that we have to Think about whether our choice of methods is appropriate. • Before finding or talking about a correlation, check the Straight Enough Condition. • Watch out for outliers! • Don’t assume that a high correlation or strong association is evidence of a cause-and-effect relationship—beware of lurking variables!
Assignments: pp. 164-170 • Day 1: # 1, 5 – 8, 21 • Day 2: # 11 – 13, 15, 20, 23, 27, 34, 41 • Reading: Chapter 8