Download
1 / 65
650 likes | 661 Views
This text explores the philosophy of science and the concept of subjective probability in Bayesian inference. It discusses Thomas Bayes and Zoltán Dienes' views on probabilities residing in the mind of individuals, rather than the external world. It also explains the use of subjective odds to assess the truth of theories and introduces the axioms of probability. The text further delves into Bayes' theorem and the posterior probability of hypotheses in light of data. Additionally, it highlights the importance of likelihood in capturing the support provided by data and distinguishes likelihood from significance testing.

E N D
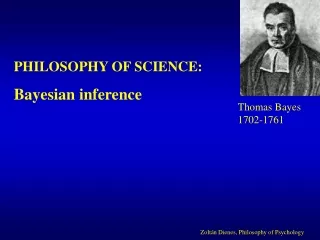
PHILOSOPHY OF SCIENCE: Bayesian inference Thomas Bayes 1702-1761 Zoltán Dienes, Philosophy of Psychology
Subjective probability: Personal conviction in an opinion – to which a number is assigned that obeys the axioms of probability. Probabilities reside in the mind of the individual not the external world. There are no true or objective probabilities. You can’t be criticized for your subjective probability regarding any uncertain proposition – but you must revise your probability in the light of data in ways consistent with the axioms of probability.
Subjective odds of a theory being true: How much would you just be willing to pay if the theory is found to be false in compensation for a commitment from someone else to pay you one unit of money if the theory is found to be true? E.g. the theory: The next toss will be heads. I will pay you a pound if the next toss is heads. Will you play if I want 50p if it is tails? 90p? £1? £1.50?
Subjective odds of a theory being true: How much would you just be willing to pay if the theory is found to be false in compensation for a commitment from someone else to pay you one unit of money if the theory is found to be true? E.g. the theory: The next toss will be heads. I will pay you a pound if the next toss is heads. Will you play if I want 50p if it is tails? 90p? £1? £1.50? Assuming the highest amount you picked is £1 Odds in favour of the next toss being heads = 1. NB: Odds = Prob(true)/Prob(false).
Subjective odds of a theory being true: How much would you just be willing to pay if the theory is found to be false in compensation for a commitment from someone else to pay you one unit of money if the theory is found to be true? Theory: There is a two-headed winged monster behind the door I will pay you a pound if we open the door and find a monster Will you play if I want 50p if there is no monster? 25p 0p??
Subjective odds of a theory being true: How much would you just be willing to pay if the theory is found to be false in compensation for a commitment from someone else to pay you one unit of money if the theory is found to be true? Theory: There is a two-headed winged monster behind the door I will pay you a pound if we open the door and find a monster Will you play if I want 50p if there is no monster? 25p 0p?? Assuming you picked 0 Odds in favour of there being a monster = 0.
Odds = Prob(true)/Prob(false) Prob(true) = odds/(odds + 1) This is a notion of probability that applies to the truth of theories! (Remember objective probability does not apply to theories) So that means we can answer questions about p(H) – the probability of a hypothesis being true – and also p(H|D) – the probability of a hypothesis given data (which we cannot do on the Neyman-Pearson approach).
Axioms of probability include: P(Y and C) = P(Y|C)*P(C) P(C) = ½ P(Y|C) = 1/3 => P(Y and C) = 1/6 ALSO P(Y) = 4/6 P(C|Y) = 1/4 => P(Y and C) = 1/6
Bayes Theorem: P(H and D) = P(H|D)*P(D) P(H and D) = P(D|H)*P(H) => P(H|D)*P(D) = P(D|H)*P(H)
Bayes Theorem: P(H and D) = P(H|D)*P(D) P(H and D) = P(D|H)*P(H) => P(H|D)*P(D) = P(D|H)*P(H) => P(H|D) = P(D|H)*P(H) /P(D) . . . (1)
Bayes Theorem: P(H and D) = P(H|D)*P(D) P(H and D) = P(D|H)*P(H) => P(H|D)*P(D) = P(D|H)*P(H) => P(H|D) = P(D|H)*P(H) /P(D) . . . (1) So considering different hypotheses for the same data P(H|D) is proportional to P(D|H) * P(H) . . . (2) Posterior probability of the hypothesis in the light of data D Likelihood Prior probability
P(H|D) is proportional to P(D|H) * P(H) • Posterior Likelihood Prior • All the support for a theory provided by data D is captured by the likelihood. • What is a likelihood? • Consider an example from the Neyman-Pearson lectures: • sample mean blood pressure with drug = Md • sample mean blood pressure with placebo = Mp
(Md – Mp) Hypothesis that “population mean = sample mean” has highest likelihood Probability of obtaining exactly that mean difference SE Likelihood p(D|H) Height of the curve for a population mean of 0 gives likelihood of null hypothesis 0 Population values of mean difference: each value is a different H
0 (Md – Mp) 0 Difference between likelihood and significance testing : p(D|H) p(D|H0) (Md – Mp) Different possible population means (H) Different possible sample means With sig testing, you are interested in the area under the curve beyond that point (significance level) With likelihood you are just interested in the height of the curve
Likelihood is gives a continuous graded measure of support for different hypotheses; significance testing asks you to make a black and white decision Likelihood reflects just what the data were; significance testing uses tail areas, reflecting what might have happened but did not. Likelihoods are insensitive to whether you are performing a post hoc test or a planned comparison, and how many other tests you are conducting.
P(H|D) is proportional to P(D|H) * P(H) Posterior probability of the hypothesis in the light of data D Prior Likelihood • We can use Bayes’ theorem to: • Calculate the probable values of a parameter (“credibility intervals”) • Compare the relative probability of different hypotheses, e.g. how likely is the alternative hypothesis compared to the null? ( “Bayes factor”)
1. Credibility intervals We want to determine how probable different population values of e.g. (Md – Mp) are. First decide on a prior Assume some normal distribution does not violate the shape of your prior too much: i.e. you think certain values are reasonably likely, and more extreme values less likely in a symmetrical way Prior prob. Possible population values of (Md – Mp) The value you think is most likely
The spread in your values – the standard deviation - can be assigned by remembering: You should think that plus or minus one standard deviation has a 68% probability of including the actual population value You should think that plus or minus two standard deviations has a 95% probability of including the actual population value The bigger your standard deviation the more open minded you are Prior prob. Possible population values of (Md – Mp) What you think the most likely value is
If the standard deviation is infinite, you think all values are equally likely – this is called a “flat prior”. You have NO idea what the population value is likely to be. Prior prob. Possible population values of (Md – Mp) • To choose a prior decide: • Does it have a roughly normal shape? • The mean of your normal (call it M0) • The standard deviation of the normal (call it S0) • Remember: There are no “right” answers! This is YOUR prior!
Prob Possible population values A possible prior: You think an effect of 0 is most plausible and you are virtually certain that the true effect, whatever it is, lies between –10 and +10 M0 = 0, S0= 3
Likelihood Prior Possible population values You collect data from a normal population; your sample has a mean of 2.8 and a standard error of 1.09. Assuming your N is above 30, you can represent the likelihood as a normal distribution with a mean of 2.8 and a standard deviation of 1.09.
p(H|D) is proportional to p(D|H) * p(H) Likelihood Prior Posterior probability Need to multiply corresponding points on the graphs: Likelihood Prior Multiplying: 0 0 0 quite big about 0 again = posterior
Posterior = likelihood * prior (scale so that area = 1) Posterior Likelihood Prior Possible population values Note: For reasonably diffuse prior, the posterior is dominated by the likelihood, i.e. by the data
If both prior and likelihood are normal, it turns out the posterior is normal. Mean of prior = M0 Mean of sample = Md Standard deviation of prior = S0 Precision of prior = c0 = 1/S02 Precision of sample = cs = 1/SE2 Posterior precision c1= c0 + cs Posterior mean M1 = (co/c1)*Mo + (cs/co)Md Posterior standard deviation, S1 = sqrt(1/c1)
95% credibility interval (also: probability interval, highest density region or HDR). Posterior 95% of area M1-1.96*S1 M1+1.96*S1 Find the values of blood pressure change that include 95% of the area: M1, plus or minus 1.96*S1.
95% credibility interval (also: probability interval, highest density region or HDR). Posterior 95% of area Population blood pressure change 0.5 4.5 Find the values of blood pressure change that include 95% of the area: You believe that there is a 95% probability of the true blood pressure change caused by the drug lies between 0.5 and 4.5 mmHg
If the prior is flat, the 95% credibility interval is the same interval as the 95% confidence interval of Neyman-Pearson. BUT different meaning: Confidence interval is associated with an objective probability: IF you repeated your experiment an indefinite number of times, the true population value would lie in the 95% confidence interval 95% of the time. However, you CANNOT make any claim about how likely THIS interval is in enclosing the true population mean You cannot really be 95% confident that the true population value lies in the 95% confidence interval Savage: I know of no good use for a confidence interval if not to be confident in it!
ALSO: Confidence interval will have to be adjusted according to how many other tests you conducted, under what conditions you planned to stop collecting data, and whether the test was planned or post hoc. Credibility interval is unaffected by all these things (EXCEPT some stopping rules – we discuss this later). The credibility interval IS affected by any prior information you had.
2. Compare the relative probability of different hypotheses, e.g. how likely is the alternative hypothesis compared to the null? ( “Bayes factor”) Bayes: P(H|D) is proportional to P(D|H) * P(H) => P(H1|D) is proportional to P(D|H1) * P(H1) P(H0|D) is proportional to P(D|H0) * P(H0)
2. Compare the relative probability of different hypotheses, e.g. how likely is the alternative hypothesis compared to the null? ( “Bayes factor”) Bayes: P(H|D) is proportional to P(D|H) * P(H) => P(H1|D) is proportional to P(D|H1) * P(H1) P(H0|D) is proportional to P(D|H0) * P(H0) => P(H1|D) / P(H0|D) = P(D|H1)/P(D|H0) * P(H1)/P(H0) posterior odds = likelihood ratio * prior odds The likelihood ratio (in this case) is called the “Bayes factor” (B) in favour of the alternative hypothesis
Consider a theory you might be testing in your project. Prior odds of the theory being true: How much would you just be willing to pay if the theory is found to be false in compensation for a commitment from someone else to pay you one unit of money if the theory is found to be true? Experimental results tell you by how much to increase your odds (B) Not a black and white decision like in significance testing. If B = about 1, experiment was not sensitive. (Automatically get a notion of sensitivity; contrast: just relying on p values in significance testing.)
EXAMPLE WITH REAL DATA: Sheldrake’s (1981) theory of morphic resonance
EXAMPLE WITH REAL DATA: • Sheldrake’s (1981) theory of morphic resonance • - Any system by virtue of assuming a particular form, becomes associated with a “morphic field” • The morphic field then plays a causal role in the development and maintenance of future systems, acting perhaps instantaeously through space and without decay through time • The field guides future systems to take similar forms • The effect is stronger the more similar the future system is to the system that generated the field • The effect is stronger the more times a form has been assumed by previous similar systems • The effect occurs at all levels of organization
Nature editorial by John Maddox 1981: The “book is the best candidate for burning there has been in many years . . . Sheldrake’s argument is pseudo-science . . . Hypotheses can be dignified as theories only if all aspects of them can be tested.” Wolpert, 1984: “ . . . It is possible to hold absurd theories which are testable, but that does not make them science. Consider the hypothesis that the poetic Muse resides in tiny particles contained in meat. This could be tested by seeing if eating more hamburgers improved one’s poetry”
Repetition priming Subjects identify a stimulus more quickly or accurately with repeated presentation of the stimulus Lexical decision Subjects decide whether a presented letter string makes a meaningful English word or not (in the order actually presented). Two aspects of repetition priming are consistent with an explanation that involves morphic resonance: Durability, stimulus specificity Unique prediction of morphic resonance: Should get repetition priming between separate subjects! (ESP)
Design: Stimuli: shared+unique shared shared+unique . . . Subject no: 1 2..9 10, . . . Subject type: resonator boosters resonator . . .
Design: Stimuli: shared+unique shared shared+unique . . . Subject no: 1 2..9 10, . . . Subject type: resonator boosters resonator . . . - There were 10 resonators in total with nine boosters between each. Resonators were assigned randomly in advance to their position in the sequence. - The shared stimuli received morphic resonance at ten times the rate as the unique stimuli - There was a distinctive experimental context (white noise, essential oil of ylang ylang, stimuli seen through a chequerboard pattern)
Design: Stimuli: shared+unique shared shared+unique . . . Subject no: 1 2..9 10, . . . Subject type: resonator boosters resonator . . . - There were 10 resonators in total with nine boosters between each - The shared stimuli received morphic resonance at ten times the rate as the unique stimuli - There was a distinctive experimental context (white noise, essential oil of ylang ylang, stimuli seen through a chequerboard pattern) Prediction of theory of morphic resonance: The resonators should become progressively faster on the shared as compared to the unique stimuli
Data for words. slope (ms/resonator) = 0.9 , SE = 3.1 Neyman-Pearson: p = 0.9, ns
Data for words. slope (ms/resonator) = - 5.0 , SE = 1.5 Neyman-Pearson: p = 0.009 significant
Morphic resonance theory: (shared – unique) RT should be more negative in the same rather than different context. 6 more resonators run in same context (ylang ylang etc); 6 in different context No difference between same and different contexts. Overall slope = 2.8 ms/resonator SE = 1.09, p = .018, still sig
Bayesian analysis P(H1|D) / P(H0|D) = P(D|H1)/P(D|H0) * P(H1)/P(H0) posterior odds = likelihood ratio * prior odds Need to determine p(D|H0) and p(D|morphic resonance exists) p(D|H0): H0: population slope = 0 p(D|H0) is just height of normal curve at a z of (mean slope)/(SE slope) i.e. at a z of -2.8/1.09 = -2.6. The height here is .013 p(D|H0) z -2.6 0
p(populaton slope|M) 0 Possible population slope p(D|morphic resonance) = ? Morphic resonance is consistent with a number of population slopes; in fact, at first blush, any slope > 0. Need to determine p(population slope|morphic resonance) for all slope values. Completely flat prior for positive slopes:
But morphic resonance cannot allow any slope: the between-subject priming must be less than within subject priming. Within a subject, RT sped up by 20 ms with a repetition. 1 resonator = 10 boosters Each booster saw each stimulus 3 times So boosting between each resonator = 30 repetitions. So slope cannot be more than 30 x 20 = 600 ms
p(population slope|M) 0 Possible population slope So slope cannot be more than 30 x 20 = 600 ms Assuming we have no preference whatsoever in thinking any of the slopes in the range from 0 to 600ms are more likely than any other value (an implausible assumption but let’s just see the consequences): 600 ms
p(data|M) 0 observed slope To go from p(population slope|M) to p(observing a slope|M) need to smear the graph by the SE of the sample. In fact, since the SE is about 1ms this smearing is negligible in this case. p(data|M) is pretty much the same as p(population slope|M) SE 600 ms
p(data|M) 0 observed slope Assume p(data|M) is given by the distribution below, where obtained sample SE =1.09 Since the distribution is SO long, i.e. so many observed values are possible, the probability of observing a slope in any one 1ms interval, e.g. 2-3ms, is actually very small! SE 600 ms
p(data|M) 0 observed slope Assume p(data|M) is given by the distribution below, where SE =1.09 Since the distribution is SO long, i.e. so many observed values are possible, the probability of observing a slope in any 1ms interval, e.g. 2-3ms, is actually very small! Actual value = 2.8 ms p(observing slope = 2.8ms| this model of morphic resonance) = .002 So Bayes factor = p(D|M)/ p(D|H0) = .002/.013 = .15 SE 600 ms
Posterior odds = Bayes factor * prior odds Bayes factor = .15 Means data should REDUCE your confidence in morphic resonance and INCREASE your confidence in the null hypothesis! Contrast Neyman-Pearson in this case: p = .018, so we reject the null hypothesis! Moral: On a Bayesian analysis, a significant result may lead one to prefer the null hypothesis even more rather than a poorly specified theory!