Download
1 / 37
370 likes | 464 Views
Structure. Harvard. 1. Diffusion-based Registration. MIT. Utah. 2.Group Effect Maps. 3. Automatic Segmentation. 1. Shape and Atlas Based Segmentation. 1. DTI Processing. 2. Statistical Shape Analysis. 2. Surface Processing. 3, DTI Connectivity Analysis. 3. PDE Implementations.

E N D
Harvard 1. Diffusion-based Registration MIT Utah 2.Group Effect Maps 3. Automatic Segmentation 1. Shape and Atlas Based Segmentation 1. DTI Processing 2. Statistical Shape Analysis 2. Surface Processing 3, DTI Connectivity Analysis 3. PDE Implementations Segmentation Registration Foundational Methods UNC Georgia Tech Structural Features and Statistics 1. Combined Statistical/PDE Methods 1. Quantitative DTI Analysis Connective Features and Statistics 2. Cross-Sectional Shape Analysis 2. Stochastic Flow Models Core 1: Overview
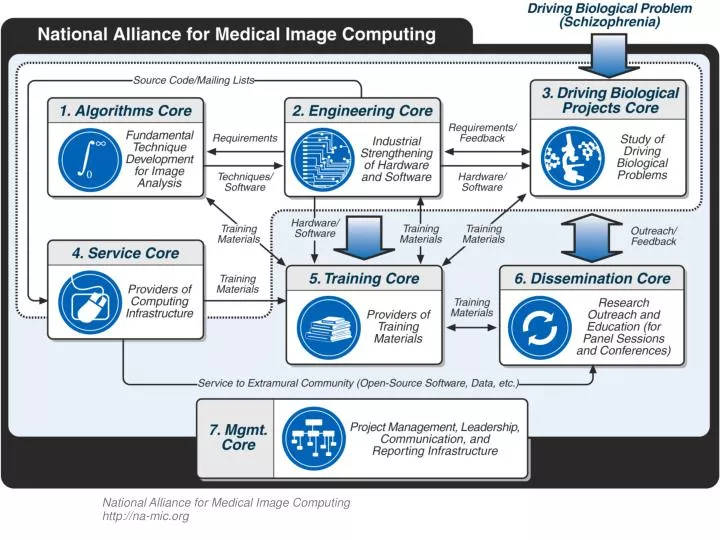
Core 1: Overview • Computational tools for image analysis • Extract anatomical structures at many scales • Measure properties of extracted structures • Determine connectivity between extracted structures • Relate disease factors to measurements
Shape Analysis • Developing pipeline protocols for population comparisons, jointly with UNC. • Integrating discriminative analysis into the pipeline: • Shape-based classification
Image M-Step Correct Intensities Bias: Predict Error MF-Step: Regularize Weights Estimate Tissue Probability E-Step Label Map EM Segmentation with Non-Stationary Tissue Priors • Integrating into Slicer
Already in NAMIC Software • Shape prior for segmentation • Leventon 2001 • Added to ITK by others • DTI visualization • O’Donnell (CSAIL), LMI (BWH) • In VTK-based 3D Slicer
Future work (6 months) • Complete shape-based segmentation implementation • Insert into toolkit • Shape based comparison and population analysis • Structural components • Tract components
Q-Ball Imaging in Slicer Estepar, Snyder, Kindlmann, Westin
VA VA VA MD MD VL VL MD VL CM CM LGN Pu Pu MGN Automatic Thalamus Segmentation Ziyan, Tuch
Future Work 1. Make QBALL available Check QBALL code into Slicer and VTK. 2. Does nonlinear registration boost stats? Measure power benefit of ITK nonlinear registration for FA group comparisons. 3. Are group comparisons based on the full tensor more sensitive? Implement and measure sensitivity of tensor-based group comparison method.
Utah Core 1 Activities • Differential Geometry for DTI analysis • Descriptive statistics of DTI • Hypothesis testing DTI • Interpolation and filtering of DTI
Curved Tensor Geometry • Natural geometry for tensor analysis • Enforces positive eigenvalues • Basis for statistics, interpolation, and processing Space of 2x2 tensors:
Descriptive Statistics • Averages and Modes of Variation • Preserves natural properties • Positive eigenvalues • Tensor Orientation • Tensor Size (determinant) • Prototype implemented in ITK
Hypothesis Testing • Tests differences in diffusion tensors from two groups • Uses full six-dimensional information from tensors • Prototype implemented in ITK • Upcoming IPMI submission
Interpolation and Filtering • Interpolation of tensors • Based on weighted averages in curved geometry • Filtering • Anisotropic filtering based on curved geometry • Implementation in progress
TensorGeometry LinearGeometry CurvedGeometry Other? Statistics Processing DescriptiveStats TensorGeometry Interpolation TensorGeometry Filtering TensorGeometry HypothesisTests TensorGeometry Software • Different tensor geometries can be defined • Each package can swap in/out different geometries
Future Work (6 months) • Further develop tensor statistics—make publicly available • Build prototypes of tensor filtering and interpolation • Continue research into DTI hypothesis testing • Methods • Exploratory Experiments
UNC: Quantitative DTI Analysis • Guido Gerig, Isabelle Corouge • Students: Casey Goodlett and Clement Vachet
UNC NA-MIC Approach: • Quantitative Analysis of Fiber Tracts • DTI Tensor Statistics across/along fiber bundles • Statistics of tensors Conventional Analysis: ROI or voxel-based group tests after alignment Patient Control selection FA Tracking/ clustering FA along tract Quantitative DTI Analysis
Example: Fiber-tract Measurements FA along cingulate cingulum Major fiber tracts uncinate fasciculus uncinate fasciculus FA along uncinate Corouge, Isabelle, Gouttard, Sylvain and Gerig, Guido, "Towards a Shape Model of White Matter Fiber Bundles using Diffusion Tensor MRI" , Proc. IEEE Computer Society, Int. Symp. on Biomedical Imaging, to appear April 2004 Gerig, Guido, Gouttard, Sylvain and Corouge, Isabelle, "Analysis of Brain White Matter via Fiber Tract Modeling", full paper IEEE Engineering in Medicine and Biology Society EMBS 2004, Sept. 2004
Tractography Data structure for sets of attributed streamlines Clustering Parameterization Diffusion properties across/along bundles Graph/Text Output Statistical Analysis Slicer (?) ITK DTI Fiber Spatial Object data structure (J. Jomier) Normalized Cuts (ITK) B-splines (ITK) NEW: DTI stats in nonlinear space (UTAH) Display/Files Biostatistics / ev. DTI hypothesis testing (UTAH) Processing Steps
Results FiberViewer Prototype (ITK) • Clustering (various metrics) • Parametrization • FA/ADC/Eigen-value Statistics • Uses SpatialObjects and SpatialObject-Viewer • Used in two UNC clinical studies (neonates, autism) • Validation: ISMRM’05
Next 6 months • Methodology Development: • DTI tensor statistics: close collab. with UTAH • Deliver ITK tools for clustering/parameterization to Core 2 • Feasibility tests with tractography from Slicer • Deliver prototype platform to Core 2 to discuss integration into Slicer • Clinical Study: DTI data from Core 3 • Check feasibility of tract-based analysis w.r.t. DTI resolution (isotropic voxels(?)), SNR • Apply procedure to measure properties of: • Cingulate (replicate ROI findings) • Uncinate fasciculus (replicate ROI findings) • Other tracts of interest
UNC: Statistical Shape Analysis • Martin Styner • Students: Ipek Oguz and Christine Shun Xu
Shape Analysis Pipeline • Clinical need: Localization of shape and volume changes • 3D objects of spherical topology • Input: Segmentation from models or binary images • Modeling Steps: • Individual surface models • Regularization • Correspondence • Alignment via Procrustes & choice of scale • Skeletal description • Structural subdivision • Statistical analysis of models
Shape Analysis Pipeline • Thickness maps • Distance to skeleton • Local shape analysis • To template or template-free • Univariate Euclidean distance • Multivariate Hotelling T2 distance • Raw p values, t/T2-maps, effect-size • Conservative correction for Type II error • MIT discriminative analysis complements our shape analysis well • Visualizations of steps for QC
Next 6 months • NAMIC toolkit development • Standardization of IO & internal representation • With MIT & Georgia Tech • Standardization of visualization tools • Automation of tools, transfer to standard • Methodology development • Non-Euclidean shape metrics with permutation tests • Probabilistic structural subdivision method • 3D visualization maps of statistical metrics • Clinical: Shape analysis data from Core 3 • Feasibility of shape analysis on data from Core 3 • Caudate shape analysis on Brockton VA/Harvard data
Georgia Tech Ramsey Al-Hakim Steven Haker Delphine Nain Eric Pichon Allen Tannenbaum
Anisotropic active contours • Add directionality
Curve minimization Registration, Atlas-basedsegmentation • Calculus of variations • Start with initial curve • Deform to minimize energy • Steady state is locally optimum • Dynamic programming • Choose seed point s • For any point t, determine globallyoptimal curve t s Segmentation
L2 Bases Functions Local Shape Analysis Our goal is to build more localized shape priors that can handle surfaces with high frequencies (high curvatures) and learn the local variations from the training set. We propose to compare different L2 bases. In particular, we would like to investigate the use of multiscale shape analysis and learn localized shape statistics from the data using bayesian statistics. The applications are shape prior for segmentation, registration and classification.
Example: Some Local Variations Finding local variations in Prostate data at different frequency levels and spatial locations Low Frequency High Frequency
Segmentation of Area 46 Using Fallon’s Rules-I Ramsey Al-Hakim BME Undergraduate
Segmentation of Area 46 Using Fallon’s Rules-II Ramsey Al-Hakim BME Undergraduate
Work in Next Six Months • Choice of anisotropic conformal factors for DTI-tractography. • Comparison of L2 bases for shape analysis (application to caudate). • Making Fallon’s rules more automatic for segmentation.