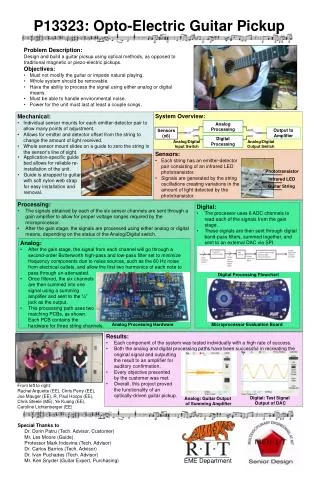
Download
1 / 14
140 likes | 244 Views
Calibration values for dipole validations at new RF probe separation distance of 1.5cm PINS-C item 5.k. Jagadish Nadakuduti EME Research Engineer, Motorola, Inc. Outline. Background

E N D
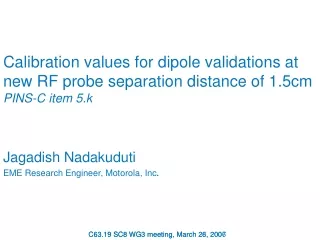
Calibration values for dipole validations at new RF probe separation distance of 1.5cmPINS-C item 5.k Jagadish Nadakuduti EME Research Engineer, Motorola, Inc.
Outline • Background • C63.19-2006 Amendment: Change the RF measurement position from bottom of probe element to the center of element and change the test distance from 10mm to 15mm • FDTD simulations • Updated Table 4.2 and Table D.4 • Measurements • Conclusion
Background: PINS-C item 5.k The RF probe separation distance is 15 mm and the calibration values in table 4.2 were made at 10 mm. These calculations need to be redone at 15 mm distance. 15 mm
FDTD simulations: E- & H-field patterns Update field values from 10 mm to 15 mm distance
FDTD simulations: Results at 10 mm • Created FDTD models as specified in “D.5.1.4 Dipole validation theoretical modeling”. • Comparison of FDTD simulations results to those specified in Table D.4. Table D-4. Results of FDTD modeling for ‘Thick dipoles’ (existing values vs. newsimulation results)
FDTD simulations: Results at 10 mm contd. • CW peak E- and H-field values taken from table D-4 are converted into RMS values. These values are incorporated into Table 4.2. Table 4.2 – Illustrated dipole calculated values (existing and new simulation results) • “D.5.1.4 Dipole validation theoretical modeling” section describes simulations for ‘thick dipoles’ and has no information on modeling parameters for ‘planar dipoles’. The relatively high difference between values specified in table 4.2 and those from new simulations in case of ‘planar dipoles’ might be because of using different simulation parameters.
Measurements:At 10 and 15 mm of probe separation distance with 100 mW of input power • Thick dipoles *898.5 MHz thick dipole is not available in the lab • Planar dipoles
Updated Table D.4 at 15 mm Table D-4. Results of FDTD modeling at 15 mm
Table 4.2 at 10 mm with measurement results Table 4.2 – Illustrated dipole calculated and measured values
Updated Table 4.2 at 15 mm with measurement results Table 4.2 – Illustrated dipole calculated and measured values
Conclusion • ‘Planar dipole’ FDTD simulations need to be repeated with the correct parameters. • The following sections in C63.19-2006 need to be updated with calibration values at 15 mm distance • In Section 4.4: • Table 4.2 • In Annex D: • Table D.4 • Figures D.3 - D.4, D.10 • Equations D.1 & D.2 • Include ‘Planar dipole’ simulation parameters in section ‘D.5.1.4 Dipole validation theoretical modeling’. • All of the above tasks can be completed in a time frame of 1-2 months.