Download
1 / 15
150 likes | 311 Views
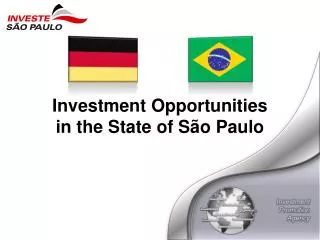
Improving Air Quality Outreach in the State of São Paulo. São Paulo State Environmental Agency – CETESB Brazil Met. Carlos Ibsen Vianna Lacava carlosvl@cetesbnet.sp.gov.br www.cetesb.sp.gov.br. 2007 NATIONAL AIR QUALITY CONFERENCE “Communicating Air Quality and Communities in Motion”

E N D
Improving Air Quality Outreach in the State of São Paulo São Paulo State Environmental Agency – CETESB Brazil Met. Carlos Ibsen Vianna Lacava carlosvl@cetesbnet.sp.gov.br www.cetesb.sp.gov.br 2007 NATIONAL AIR QUALITY CONFERENCE “Communicating Air Quality and Communities in Motion” Orlando - Florida - February 11-14, 2007
SÃO PAULO METROPOLITAN AREA - SPMA • Most industrialized State in Brazil • 38 million people • São Paulo Metropolitan Area (SPMA) • ~8,000 km2 • 45 km from Atlantic Ocean • Average altitude - 720m • 39 cities • 18 million people • Largest industrialized area in São Paulo State
SPMA • Industries: ~50,000 • Vehicles: • Gasohol:~6,5million (78%gasoline/22% ethanol)v/v • Ethanol: ~1 million • Diesel: ~450,000 / motorcycles ~500,000 • Summer:(December-March) • Rainy season – good ventilation – sea breeze – average max temperature: 30o C • Winter: (May-September) • Low rain - calm hours - low relative humidity - thermal inversion <200m -average minimum temperature: 8o C
O3 – Number of Exceedances Standard and Attention Level 1-hour Average (1997-2005)
IN 2005, CETESB STARTED A PROGRAM TO IMPROVE AIR QUALITY OUTREACH • AIR QUALITY OUTREACH BEFORE THE PROGRAM: • The information was insufficient and difficult for the population to access • No connection made between broadcast air quality and its potential associated health effects; • Air quality broadcast just once a day (not in real time); • Simplified forecast of dispersion of the pollutants. The index was not forecasted; • No information about how people could avoid air pollution health effects; • No colors associated with the air quality index, making visualization difficult in some media. Text inaccessible to illiterate people; • Hard to find the air quality information in the Cetesb web site.
AIR QUALITY OUTREACH BEFORE THE PROGRAM: • Difficulty reaching the media • Available information from Cetesb to TV, radio and press was insufficient; • Little interest shown by the media in publishing the air quality conditions; • Little contact with the different sectors of media. • Little integration between health sectors, education and municipal administration • Difficult to act jointly; • Lack of technical basis relating air quality and health effects; • Little awareness by some cities and other agencies of the public administration concerning the measurement of the air quality by Cetesb; • Few educational material on the subject.
OBJECTIVE OF THE PROGRAM: INCREASING OF AIR QUALITY INFORMATION AND CREATING NEW STRATEGIES OF COMMUNICATION WITH THE PUBLIC • Expected benefits of the new program • To improve the communication between Cetesb and the public concerning the air pollution problem; • To raise public awareness about the problem of the air pollution; • To promote changes in people’s behavior in order to avoid unhealthy exposures to high concentrations of pollution; • To establish an ease-to-understand body of information relating pollution and health effects; • To promote public participation in measures to reduce pollutants emissions, especially on bad air days; • To promote greater integration among environment, health, education and transport sectors.
THE PROGRAM FOCUSED ON THREE MAIN GOALS • 1. To establish a technical basis of air quality and health responses to make possible the improvement of public communication • To review and revise the current air quality index, making it consistent with the current body of health effects evidence from national and international epidemiological studies. • To review the descriptors (Good, Regular, Inadequate, Bad, Very Bad) and to associate colors with them; • To identify health effects related to index categories and develop precautionary messages; • To establish the spatial representativeness of the air quality information.
THE PROGRAM FOCUSED ON THREE MAIN GOALS • 2. To create new information, reformulating the existing outreach products, such as Cetesb webpage and street panels; • To consider new forms of air quality outreach linked to messages of health effects and prevention; • To increase the frequency of air quality outreach; • To use colors in air quality outreach; • To implement web cameras for evaluation of visibility and visualization in the Internet; • To publish daily messages with diagnostics and air quality forecast. • 3. To encourage and to help media including TV stations, radio and media press, publish air quality conditions.
Products • New air quality index, including colors and the meaning in terms of health; • Technical basis relating air quality and health effects, as well as massages about how to avoid unhealthy exposure to high concentrations; • New air quality web pageincluding the hourly air quality conditions near real-time and presenting the respective health messages; • Daily reportwith meteorological conditions, air quality forecast, health effects and exposure reduction recommendations; • Educational pamphlets about air quality for the public using accessible language.
Next steps: • Development of new products to be published in the different media (TV, radio station, press and street panels); • Implementation and improvement of air quality forecast models for the region; • Local television stations and other media include the air quality conditions and forecast in the weather daily reports.
At the end of this project, we expect that the public will incorporate air quality information into their daily routines, using it to reduce emissions and protect their health from air pollution.