Download
1 / 18
180 likes | 289 Views
Proposed Capital Cost Modifications for MDTF Scenarios. October 2, 2012. Arne Olson, Partner Nick Schlag, Consultant. Contents. Proposed modifications for capital cost trajectories for resources using learning curves Solar PV Wind

E N D
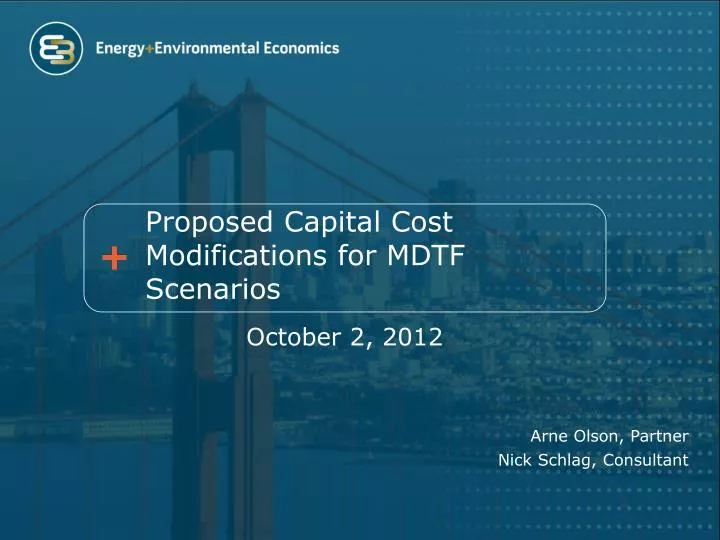
Proposed Capital Cost Modifications for MDTF Scenarios October 2, 2012 • Arne Olson, PartnerNick Schlag, Consultant
Contents • Proposed modifications for capital cost trajectories for resources using learning curves • Solar PV • Wind • Proposed modifications for capital cost trajectories for resources using survey estimates • Solar Thermal • IGCC with CCS
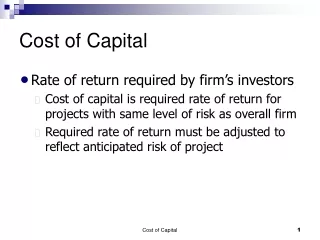
Learning Curve Theory • To forecast cost reductions for solar PV and wind in the reference case, E3 has applied historically observed “learning curves” • Learning curves describe an observed empirical relationship between the cumulative experience in the production of a good and the cost to produce it • Increased experience leads to lower costs due to efficiency gains in the production process • Applying learning curves requires specifying two key parameters: • The learning rate, the expected decrease in costs with a doubling of experience • A forecast of cumulative global installed capacity over the analysis horizon
Framework for Cost Reductions in the Reference Case • For the Reference Case, the forecasted capital costs represent E3’s unbiased estimates of cost reductions • Such a framework implies reasonable probabilities that actual cost reductions may be larger orsmaller than E3 has forecast • E3’s Reference Case forecasts of capital costs represent the origin of the scenario axis • To achieve this end, the Reference Case assumes: • Persistence of historically observed learning rates • Continuation of current market growth trends Economic Growth Technology Innovation Ref. Case
Application of Learning Curves to the Scenarios • To explore the space of potential cost reduction trajectories, E3 has chosen to vary both the global installed capacity and the technology learning rates • While using historically observed learning rates is appropriate for a Reference Case, E3 believes it is important to consider the possible deviation from these rates in scenario analysis • Learning rates are an empirical observation; without a physical underpinning, there is no guarantee that historical rates will continue • Learning rates cannot capture step changes in technology that may occur • “Learning” is not the only factor that affects capital costs over time; varying the learning rate can serve as a proxy for other factors that are difficult to predict
Learning Curves and the Scenario Axes • The defining axes for the scenarios are well-suited to a framework where changing each of the learning curve’s key parameters yields cost reductions consistent with scenario drivers High Economic Growth Greater growth of global capacity than Reference Case Rapid global growth coupled with substantial technological innovation enable large cost reductions Despite slow innovation, rapid global growth allows for modest cost reductions Ref. Case Low Technology Innovation Lower learning rate than Reference Case High Technology Innovation Higher learning rate than Reference Case Technological innovation is partially offset by slower global growth, leading to more modest cost reductions Stagnation of global economy and lack of innovation result in limited cost reductions Low Economic Growth Lower growth of global capacity than Reference Case
Summary of Recommended Learning Curve Inputs Solar PV * Learning rate shown is system composite rate, the implied blend of the independent rates used for modules and BOS Wind
Proposed Reductions – Solar PV • Reference Case Assumptions • Global capacity (~90 GW in 2012) grows by 27 GW per year to reach 634 GW by 2032 • Learning rates are 20% (modules) and 10% (BOS) • Cost reduction in 2032 is 34% in the Reference Case 2032 Solar PV Cost Reduction Global capacity: Reaches 1,700 GW in 2032 on track to surpass 3,000 GWin 2050 (IEA Technology Roadmap goal) 34%* 59% Learning rates: 15% (modules) 5% (BOS) Learning rates: 25% (modules) 15% (BOS) 34% 16% 34%* * Calculated reductions for Scenarios 1 & 4 were close enough to the Reference Case that E3 recommends using the Reference Case values for solar PV in those scenarios Global capacity: Growth is half of Reference Case (reaches 363 GW in 2032)
Benchmarking Cost Reduction Potential (Utility Scale Fixed PV) This methodology yields cost reduction estimates for the various scenarios that span most of the observed estimates for future installed PV costs Note that costs shown above are expressed relative to DC nameplate rating
Proposed Reductions – Wind • Reference Case Assumptions • Global capacity (276 GW in 2012) grows by 43 GW per year to reach 1,900 GW by 2032 • Learning rate is 5% • Cost reduction in 2032 is 10% in the Reference Case 2032 Wind Cost Reduction Global capacity: Reaches 1,210 MW in 2032 on track to surpass 2,000 GWin 2050 (IEA Technology Roadmap goal) 0% 21% Learning rate: 0% Learning rate: 10% 10% 0% 15% Global capacity: Growth is half of Reference Case (reaches 682 GW in 2032)
Solar Thermal • E3 has not conducted a learning curve analysis for solar thermal, instead relying on a survey of point estimates of future costs • This approach can still provide useful bounds for scenario analysis Proposed trajectories are shown for Scenarios 2 and 3—which have the most and least innovation, respectively—based on survey results for future costs
Proposed Reductions – Solar Thermal • Reference Case Assumptions • Cost of solar thermal without storage declines by 25% by 2032 in the Reference Case 2032 Solar Thermal Cost Reduction (no storage) 25% 40% 25% 10% 25%
IGCC with CCS • Reference Case assumes cost of IGCC w/ CCS remains at $8,000/kW throughout analysis horizon • Only Scenario 2 contemplates a breakthrough in CCS technology • To determine the appropriate breakthrough, consider two questions: • What cost reduction will make IGCC w/ CCS cost competitive with traditional (CCGT) generation? • Is this level of cost reduction reasonable given the literature on CCS costs? 2032 IGCC w/ CCS Cost Reduction 0% ??? 0% 0% 0%
Economic Comparison: IGCC w/ CCS and CCGT Costs • Cost reduction required to allow IGCC w/ CCS to compete with CCGT decreases as the cost of carbon increases • At a carbon cost of $100/ton, the capital cost of IGCC w/ CCS would have to be approximately 35% lower to meet the cost of current CCGT technology Comparison made assuming 85% capacity factors for both technologies, $7.09/MMBtu gas, and $1.62/MMBtu coal
Survey of IGCC w/ CCS Costs Surveyed Capital Costs for IGCC w/ CCS Most cost estimates for IGCC w/ CCS plants are 30-50% lower than E3’s recommended Reference Case cost ($8,000/kW) * Capital cost explicitly excludes the costs infrastructure for CO2 transport & sequestration Capital costs shown have been converted to all-in costs and are expressed in 2010 dollars
IGCC with CCS • A 40% reduction in capital costs would yield an LCOE for IGCC with CCS that is: • …comparable in magnitude to the results of NETL’s engineering studies, which show the lowest costs for CCS technologies of all sources surveyed • …competitive with traditional gas CCGTs under the gas, coal, and carbon pricing assumptions specified for Scenario 2 2032 IGCC w/ CCS Cost Reduction 0% 40% 0% 0% 0%
Summary of Recommendations • The following table shows representative results of E3’s recommended resource costs for the MDTF scenarios • Capital costs correspond to resources installed in 2032 Solar PV cost shown is for a utility-scale fixed tilt system. Cost is expressed in $/kW-AC.
Thank You! Energy and Environmental Economics, Inc. (E3)101 Montgomery Street, Suite 1600San Francisco, CA 94104Tel 415-391-5100Web http://www.ethree.com Arne Olson, Partner (arne@ethree.com)Nick Schlag, Consultant (nick@ethree.com)