Download
1 / 27
280 likes | 413 Views
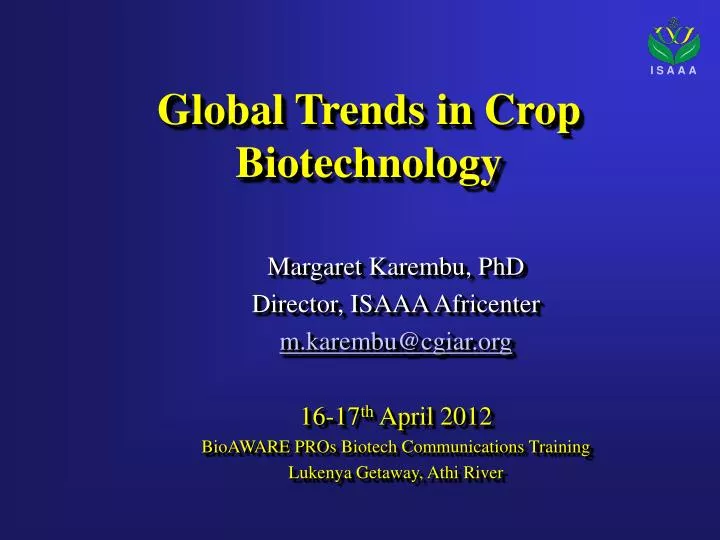
Global Trends in Crop Biotechnology . Margaret Karembu, PhD Director, ISAAA Africenter m.karembu@cgiar.org 16-17 th April 2012 BioAWARE PROs Biotech Communications Training Lukenya Getaway, Athi River . Overview of Presentation . THE GLOBAL CHALLENGE

E N D
Global Trends in Crop Biotechnology Margaret Karembu, PhD Director, ISAAA Africenter m.karembu@cgiar.org 16-17th April 2012 BioAWAREPROs Biotech Communications Training Lukenya Getaway, Athi River
Overview of Presentation • THE GLOBAL CHALLENGE • COMMERCIALIZATION 1996 to 2011 • GROWING IMPORTANCE OF DEVELOPING COUNTRIES – Brazil • IMPACT OF BIOTECH CROPS (1996 to 2010) • FUTURE PROSPECTS – 2012-2015 (MDG)
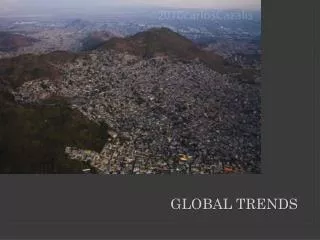
The Global Challenge Increased demand for Food, Feed, Fiber and Fuel 4Fs • World population will grow from current 6.5B to 8B by 2025 and 9.2B by 2050 • Affluence in emerging economies will drive meat, cereals, edible oil consumption up • Climate change will limit water availability; introduce new pests • Increase in biofuel consumption
COMMERCIALIZATION OF • BIOTECH CROPS • 1996 to 2011
Global Area (Million Hectares) of Biotech Crops, 2011: by Country Biotech Mega Countries 50,000 hectares (125,000 acres), or more Million Hectares 1. USA 2. Brazil* 3. Argentina* 4. India* 5. Canada 6. China* 7. Paraguay* 8. Pakistan* 9. South Africa* 10. Uruguay* 11. Bolivia* 12. Australia 13. Philippines* 14. Myanmar* 15. Burkina Faso* 16. Mexico* 17. Spain 69.0 30.3 23.7 10.6 10.4 3.9 2.8 2.6 2.3 1.3 0.9 0.7 0.6 0.3 0.3 0.1 0.1 29 countries which have adopted biotech crops In 2011, global area of biotech crops was 160 million hectares, representing an increase of 8% over 2010, equivalent to 12 million hectares. Increase over 2010 Less than 50,000 hectares 8% Colombia* Chile* Honduras* Portugal Czech Republic Poland Egypt* Slovakia Romania Sweden Costa Rica* Germany Source: Clive James, 2011. * Developing countries
Acceptance Issues related to Biotech Crops • Food safety – food as safe, or safer, than conventional • Environmental Impact • Gene Flow– conservation of biodiversity – coexistence • Effect on non-target organisms – Target specific tech • Management of Bt resistance – durability, a challenge • Ownership of the technology • Role of the Private sector, IPR – public/private balance • Ethical considerations – the right to food • Above issues impact on INTERNATIONALTRADE Source: Clive James, 2012
Principal Biotech/GM crops - Globally Cotton Soybean Maize Canola
GROWING IMPORTANCE OF • DEVELOPING COUNTRIES
OVERVIEW OF DEVELOPING COUNTRIES versus INDUSTRIAL, 2011 • 19 out of 29 biotech countries were Developing • For first time dev countries planted 50% of global area • Expected to exceed industrial country hectares in 2012 • Brazil largest gain worldwide – 4.9 M Ha, 19% of global • Top 7 Developing countries planted >2 M Ha each • Growth rate twice as fast 8.2 M Ha (11%) vs 3.8 M Ha (5%) • ~16 M small biotech farmers, up ~1.3 M from 2010. • 1996-2010 Econ gain $39.2 B; in 2010 $7.7 vs $6.3 in Industrial Source: Clive James, 2012
Brazil in Latin America Land Area: 850 M Ha Population: 195 Million Arable land: 59 M Ha Commercialized Biotech Crops: HT soybean, Bt cotton and Bt maize Biotech Crops Hectarage: 30 M Ha
BRAZIL – THE LEAD DEVELOPING COUNTRY • Ranked #2 with 30.3 M Ha equivalent to 19% of global area of 160 M Ha in 2011 • Biotech Soy >20 M Ha (83% adoption), biotech maize >9 M Ha (65% adoption) and biotech cotton >0.5 M Ha (39% adoption) • Largest hectare gain worldwide for third consecutive year – 4.9 M Ha equivalent to 19% growth in 2011 • Economic gain 2003-2010 – $4.6 B; $1.2 B in 2010 alone • EMBRAPA is Ag. R & D organization with cooperative programs in Africa – CTNBio is regulation agency • Former President Ignacio Lula da Silva awarded World Food Prize in 2011 for alleviating Poverty and Hunger Source: Clive James, 2012
BRAZIL – THE STRATEGIC ELEMENTS • INSTITUTIONAL STRENGTHS • EMBRAPA –Strong biotech program, well-resourced • CTNBio – Effective & timely deregulation – 14 products approved in 2010/2011 • DIVERSIFIED SOURCE OF PRODUCTS 3 product streams • Private – Proprietary products deployed on 30 M Ha • Public/Private – Joint effort of EMBRAPA/BASF has already resulted in approved HT soybean • Public – EMBRAPA has already developed and approved home-grown virus resistant biotech bean • 3 product streams, minimizes opportunity cost and maximizes impact Source: Clive James, 2012
Africa Overview Biotech Crops planting 2011 • Biotech commercial South Africa - Maize, cotton, soybean • Egypt - Maize • Burkina Faso - Cotton • Biotech crops on trial • RSA - potatoes, sugarcane, • WEMA – RSA, Kenya, Uganda Kenya – cotton, maize, SP, cassava Egypt – cotton, potato, wheat, cucumber, melon Uganda - banana, cotton, cassava, maize, rice Nigeria - cowpea, cassava
Case Study – Biotech cotton in Burkina Faso Pictures: SOFITEX cotton company, Dec 2011
Total cotton hectarage in Burkina(424,810 ha) In 2011, ~247,000 (58%) hectares Bt cotton planted, from 260,000 hectares in 2010 Slight decline of 5% (or 13,433ha)- Key reasons for decline : Farmers dissatisfied with purchase price offered for their 2010 cotton(245 CFA/Kg~0.5 USD for Bt or non Bt cotton)-Desired price:500CFA/Kg~1USD) Farmers discouraged by rising costs of fertilizer Poor agronomic practices Erratic rains after planting ~ 76,000 farmers planted Bt cotton Adoption rate for Bt cotton: 58% Case Study – Biotech cotton in Burkina Faso
Estimated economic benefit from Bt cotton - over US$100 million/yr based on yield increases of close to 30%, plus at least 50% reduction in insecticides sprays, from a total of 8 sprays to only 2 to 4 sprays for Bt cotton Biotech cotton in Burkina Faso
GLOBAL IMPACT OF BIOTECH CROPS Source: Brookes and Barfoot, 2012 Forthcoming; Clive James, 2012 • IMPROVED PRODUCTIVITY AND INCOME – Farm income gains of $78 B from 1996 to 2010, of which 40% was due to cost reduction and 60% due to a production gain of 276 M tons; benefits conservative due spill-over from biotech to conventional. • PROTECT BIODIVERSITY–276 M tons would require additional 91 M Ha– biotech is a land saving technology. Strategy is to double crop production on same area of 1.5 B Ha of crop land –saves forests/biodiversity–13 M Ha lost/year. • ENVIRONMENTAL IMPACT–Reduce need for external inputs – Saving of 443 M kg pesticides from 1996/2010 – 9% saved • – Saved 19 B kg C02 in 2010 -contribution to climate change • – Conservation of soil & WATER thru biotech + no/low till • HUMANITARIAN BENEFITS • – Contribution to poverty alleviation of ~16 M small resource-poor farmers in 2011 & welfare benefits emerging
THE FUTURE 2012 - 2015 THE REMAINING FOUR YEARS OF THE SECOND DECADE OF COMMERCIALIZATION 2015, The Millennium Development Goal Year
THE FUTURE–2012 - 2015 NEW & IMPROVED BIOTECH CROPS • Several new biotech crop options --- 3 examples • 2012 – first stacked HT/IR soybean, particularly Brazil • 2013 – first drought tolerant maize in US; in Africa ~2017 • 2013/14 – Golden Rice in the Philippines; US, omega 3 soy • Other candidates before 2015 include: several dual-action products for more effective & durable pest and weed management; and possibly biotech sugar cane in Indonesia • Biotech applications for “Speeding the breeding”–MAS and others, plus biotech crops, to provide a faster response to more severe and rapid changes in climate
EGYPT UGANDA UGANDA MALI KENYA KENYA BURKINA FASO TANZANIA TOGO MALAWI NIGERIA NIGERIA SOUTH AFRICA Ongoing Biotech Crop Field Testing Implementation of APPROPRIATE REGULATION is a MUST to spur adoption of biotech crops in AFRICA Source:Compiled by Clive James, 2012 EGYPT BURKINA FASO SOUTH AFRICA 2015 (up to 10 countries) South Africa, Burkina Faso, Egypt, Kenya, Uganda, Mali, Togo, Nigeria,, Ghana and possibly Malawi 2011 (3 countries) South Africa, Burkina Faso and Egypt
Way forward for Africa Biotech crops are a product of INNOVATION“the ability to manage change as anopportunity, not as a threat”We therefore need to communicate with society objectively and consistently
ISAAA’s Global Knowledge Center 24 Biotechnology Information Centers (BICs) Russia ISAAA AmeriCenter Spain China Japan Italy Pakistan Bulgaria Bangladesh Egypt Mali India Vietnam Thailand Philippines ISAAA’s Global KC Sri Lanka Burkina Faso Kenya Malaysia Indonesia Brazil South Africa Knowledge and Experience Sharing