Download
1 / 14
150 likes | 303 Views
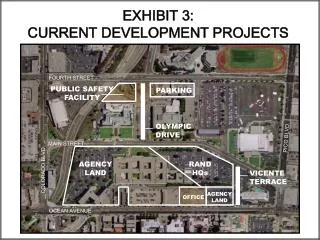
TOD Parking Utilization. SJSU/VTA Collaborative research Project Santa Clara County Justin Meek, AICP | November 9, 2012. Project Objectives. Survey utilization at TOD residential projects Corroborate findings of other research on the topic (e.g., Cervero et al, 2009)

E N D
TOD Parking Utilization SJSU/VTA Collaborative research Project Santa Clara County Justin Meek, AICP | November 9, 2012
Project Objectives • Survey utilization at TOD residential projects • Corroborate findings of other research on the topic (e.g., Cervero et al, 2009) • Provide localdata for the South Bay • Provide relevant information for similar projects throughout the U.S. • Evidence that reduced parking standards may be permissible
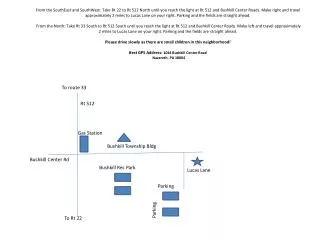
Criteria Within ½ mile of a transit station Minimum residential occupancy of 85% Over one year old Free parking Restricted/designated parking Open surface parking or podium garage(i.e., no townhomes/developments with private garages) At least 80 units or 100 parking spaces
Methodology • 12 survey sites • Nearby transit stations • VTA Light rail: Mtn. View, Fair Oaks, Tasman, River Oaks, St. James, Santa Clara, San Antonio, Race, Tamien, Ohlone-Chynoweth, and Almaden • Caltrain: Mountain View and Santa Clara • Conducted mid-week (Tuesday – Thursday) • Surveyed peak period (between 12 and 4 a.m.)
Key Findings • Parking Utilization • 2,496out of 9,751 spaces were unused (26%)
Key Findings • Parking Utilization • Utilization ranged from 61% to 83% Parking Demand
Key Findings • Parking Utilization • 2,496 out of 9,751 spaces were unused (26%) • Utilization ranged from 61% to 83% • Parking Supply • 1.7 spaces per dwelling unit provided • Parking Demand • Only1.3spaces per dwelling unit needed • Comparison to local requirements • Demand rates near the bottom or below parking requirements • Suggests that TOD residential properties near rail stations in Santa Clara County are “over-parked”
Parking Demand < Zoning Requirements Utilized Parking Spaces/Occupied Housing Units
East Bay Parking Demand Rates • Average - 25% over supply Source: Are TODs Over-Parked (Cervero, Adkins and Sullivan 2009)
Cost of Unutilized Spaces • Capital costs $37.4 million* • Maintenance and operation $2 million per year* * $15,000 per space * 2,496 spaces = $37.4 million * $800 per year per space * 2,496 spaces = $2 million
Resources • Report title: A Parking Utilization Survey for Transit-Oriented Development Residential Properties • SJSU, Urban & Regional Planning website www.sjsu.edu/urbanplanning/communityplanning/ • Report www.sjsu.edu/urbanplanning/docs/VTA-TODParkingSurveyReport-VolI.pdf • Report Appendices www.sjsu.edu/urbanplanning/docs/VTA-TODParkingSurveyReport-Vol2.pdf • Report Summary (8 pages) www.sjsu.edu/urbanplanning/docs/VTA-TOD_ParkingSurveySummary.pdf