Download
1 / 63
630 likes | 728 Views
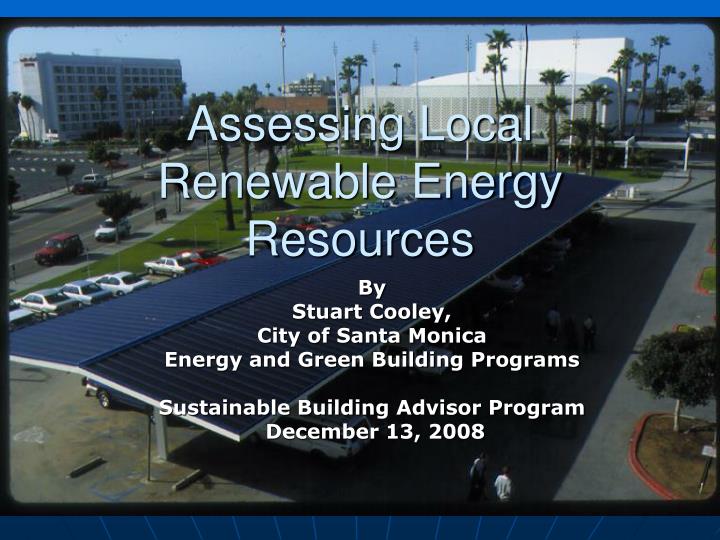
Assessing Local Renewable Energy Resources. By Stuart Cooley, City of Santa Monica Energy and Green Building Programs Sustainable Building Advisor Program December 13, 2008. Source: Holdren. Can you spot the change in data?. World, US, and Chinese Energy Supply, 2000.

E N D
Assessing Local Renewable Energy Resources By Stuart Cooley, City of Santa Monica Energy and Green Building Programs Sustainable Building Advisor Program December 13, 2008
World, US, and Chinese Energy Supply, 2000 World USA China Primary Energy (exajoules) 450 105 46 of which… Oil 35% 38% 22% Natural Gas 21% 25% 2% Coal 23% 25% 49% Nuclear Energy 6% 8% 0.4% Hydropower 2% 1% 2% Biomass and Other 13% 4% 25% Source: Holdren
Primary forms sunlight biomass & peat hydropower wind waves, ocean currents ocean heat fossil fuels: coal, oil, gas, oil shale, tar sands, methane clathrates geothermal energy tidal energy Primary forms (continued) fission fuels (U, Th) fusion fuels (H2, Li, He3) Secondary forms charcoal (from wood) alcohol (e.g. ethanol from any biomass) “town gas” (from coal) gasoline (from oil) synfuels (from coal, oil shale, hydrogen) electricity (from anything) Primary & secondary energy forms Source: Holdren
Are we running out of energy? SOME REMAINING ULTIMATELY RECOVERABLE NONRENEWABLE RESOURCES (in terawatt-years) OIL & GAS, CONVENTIONAL 1,000 UNCONVENTIONAL OIL & GAS (excluding clathrates) 2,000 COAL 5,000 METHANE CLATHRATES 20,000 OIL SHALE 30,000 URANIUM 2,000 URANIUM [Breeder] 2,000,000 FUSION FUELS (if fusion ever works) up to 250,000,000,000 SOME RENEWABLE RESOURCES (in terawatt-years per year) SUNLIGHT REACHING EARTH’S SURFACE 88,000 ENERGY FLOW IN THE WIND 2,000 NET PRIMARY PRODUCTIVITY 100 Business-As-Usual (BAU) human use (forecast for 2100) ≈ 60 TWy per year Source: Holdren
So what’s local: • Sun • Wind • Warm Air (Heat Pump) • Cool ground (Geo-Exchange) • Ocean • Waves, Currents • Tides Small hydropower (not in LA!) Biomass (MSW, Cuttings, Methane (biogas))
What does it mean when a resource is half gone…? Peak Oil Source: www.oilposter.org
Fossil fuels are a problem. Source: www.everybodysweather.com
Geo-Exchange • Geothermal • Earth thermal • Ground-Source (Heat Pump) Vertical Horizontal
Nuclear Energy is the Answer! • Clean burning hydrogen fuel • Almost inexhaustible source of energy • Properly located in a remote location • Provides both heat and electricity to a distributed grid at no cost • Accessible by all–in everyone’s back yard • No (additional) global warming • No greenhouse gases
Energy Availability • Solar energy falling on an area the size of Rhode Island can provide enough power for the entire U.S.
Forms of Solar Energy Technology • Solar Thermal • Hot water heating (pool and DHW) • Passive and active space heating • Solar Electric • Photovoltaic • Monocrystalline • Polycrystalline • Amorphous silicon (½ as efficient, ½ the cost)
Types of Solar Thermal Integrated Collector System Evacuated Tube Collector System
Forms of Solar Electric Technology • Photovoltaic • Monocrystalline • Polycrystalline • Amorphous silicon (½ as efficient, ½ the cost) • Concentrating Photovoltaic
Monocrystalline • High efficiency cells • Some “dead space”
Polycrystalline • Building Integrated PhotoVoltaics (BIPV)
Amorphous • Flexible – often used with standing seam roof types and BIPV
Concentrating Solar Collectors • Usually requires tracking mechanism Utility scale Residential Scale CS Collectors
Solar “Panels”also known as “modules” • Could be thermal • Could be electric • Solar hot water systems had a surge of interest in the late 70’s and early 80’s thanks to tax incentives • Many thermal systems are “down” but not “out” • Solar panels today usual refer to “photovoltaic” arrays (solar electric)
Solar Electric Systems: To be connected or not to be connected • On-grid or grid-tied • Net-metered • Eliminates need for batteries • Uses the utility as your “battery” • Note: You aren’t protected against outages! • Off-grid; remote application; battery-back-up • Eliminates cost for transmission and distribution • Requires load management generally • Battery maintenance and disposal an issue
AC or DC • AC= Alternating (household) Current • DC= Direct Current( battery-like) • Your home uses AC • Solar photovoltaic produces DC • Generally you have an inverter that converts DC electric to AC electric and allows you “normal” plug power
Size of Solar • Typical home uses 1 – 2 kW on average • Peak power can be 10 kW or more • Hair dryer = 1 kW, Oven 2 kW, electric water heater 2-4 kW, vacuum cleaner 1-2 kW, air conditioner 1-3 kW etc. • Size of solar is based on annual net energy production matched to annual use • Net production can be no greater than 0 at the end of the year – no cash for overproduction
Net Metering • Size of solar is based on “net energy” desired. Net = Used – Produced • Rebate system allows you to choose between • “Time-Of-Use” (TOU) • “Tiered” Rate Structure
Net MeteringTOU • You are credited with the cost savings associated with your Time Of Use • Peak:54 cents, between 12 and 6 pm • Mid-peak: 6pm to 11pm and 7am to 12 noon • Off peak: 11 pm to 6 am
Net MeteringTiered • You are credited with the highest cost energy first and subsequent production earns you less per kWh. • 32 cents per kWh (top tier) • 14 cents per kWh (bottom tier)
Steps to Getting Solar • Size the system (get quotes) • Pick a panel/inverter/installer • Put money down and file for your rebate • Get system installed and inspected • Get Net Metering and Interconnection agreement from SCE • Enjoy reduced (or zero!) bills
And voilà… • You get one happy, carbon-neutral, zero-energy, smug household
Example: 1.8 kW of solar photovoltaics • $50 per month bill went to $0 • About $30 saved per kW installed 24 panels x 75 Watts/panel = 1.8 kilowatts = 1.8 kW