Download
1 / 9
100 likes | 191 Views
State and Activity Diagram. Nyimas Sopiah. State Diagram.

E N D
State and Activity Diagram Nyimas Sopiah
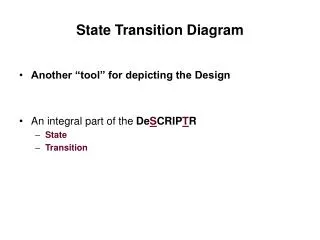
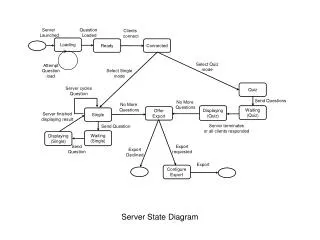
State Diagram • State diagrams (also called State Chart diagrams) are used to help the developer better understand any complex/unusual functionalities or business flows of specialized areas of the system. In short, State diagrams depict the dynamic behavior of the entire system, or a sub-system, or even a single object in a system. This is done with the help of Behavioral elements.
Activity Diagram • Activity diagrams represent the business and operational workflows of a system. An Activity diagram is a dynamic diagram that shows the activity and the event that causes the object to be in the particular state.
Let us consider the example of attending a course lecture, at 8 am.