Download
1 / 5
50 likes | 163 Views
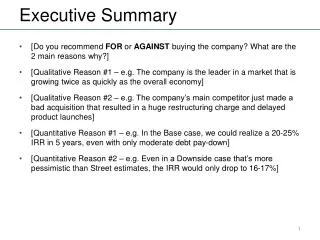
Executive Summary for Internal Transfers. Twelve Months Activity for Internal Employee Transfers April 2000 to March 2001 activity total 3,174 (25% of domestic workforce) – includes 1,189 Major Reorganizations due to creation of Networks, EGM, EIM, etc

E N D
Executive Summary forInternal Transfers • Twelve Months Activity for Internal Employee Transfers • April 2000 to March 2001 activity total 3,174 (25% of domestic workforce) – includes 1,189 Major Reorganizations due to creation of Networks, EGM, EIM, etc 969 Open and Free Talent Market – 9% of domestic workforce 481 Analyst and Associate planned rotations 273 Automatic redeployment due to Business Re-organization 262 Formally redeployed by the Redeployment Team • Formal Redeployment • 511 employees have participated in formal redeployment of which 51% or 262 have been successfully placed • 149 of the 511 employees are currently still in redeployment today of which most have been there 11-20 days. • Of those successfully placed by the redeployment team, most were placed in 8 days; average is 21 days. • Automatic Redeployment Due to Business Reorganization • 273 employees have been automatically redeployed under recent reorganizations. Note: Domestic headcount as of 11/00.
Internal Domestic Transfers 4/1/2000 to 3/31/2001 Analysts and Associates Rotations 481 Total 3,174 Total Internal Domestic Transfers 3,174 Major Reorganization Transfers 1,189 (color coded above) Actual Transfers 969 Analyst/Associate Planned Rotations 481 Automatic Redeployment 273 (due to Business Reorganization) Formal Redeployment 262 From April 1, 2000 through March 31, 2000, 437 commercial employees and 2,256 non-commercial employees transferred within Enron.
Summary Statistics – Formal Redeployment Formal Redeployment Activity Sent to Formal Received from Formal BURedeploymentRedeployment A/A Program 0 3 Apachi 3 0 Azurix 8 1 Calme 54 2 Corp 61 58 EBS 274 11 EECC/EEOS 59 1 EES 1 75 EGEP 6 2 EGM 0 3 EIM 0 4 ENA 10 19 ENW 10 49 ESA 13 2 ETS 2 7 EWC 0 1 India 9 1 PGE 1 0 Other 023 Total 511 262 Formal Redeployment Program Participation June 1, 2000 through April 2, 2001 Number% Number of Employees Placed 262 51% Number of Employees Terminated* 100 20% Number of Employees to be Placed 149 29% Total Number of Employees Placed in Formal Redeployment 511 100% Aging of Employees to be Placed 1-10 Days 1 11-20 Days 127 21-30 Days 5 31-44 Days 9 45+ Days 7 Total Aging in Formal Redeployment Number of Days in Redeployment AverageMedian Total Employees 22 9 Placed Employees 21 8 Terminated Employees 40 43
Summary Statistics – Formal Redeployment * Unless noted, all data and statistics based on period June 1, 2000 through April 2, 2001. ** Since January 1, 2001, 263 employees have been terminated due to Business Reorganization. During this same period, 58 employees who were in the redeployment group were terminated.
Automatic RedeploymentDue to Business Reorganization Former Business UnitEmployees TransferredNew Business Unit EECC 32 ETS 22 EEOS* 17 EES 3 CORP 2 NEPCO 2 ENA 78 EBS 39 ENW 32 Corp 71 CALME 54 EGM 24 Corp 22 ESA 17 EES 6 ENA 1 EBS 124 TOTAL 273 * Some EECC employees were initially expected to be transferred but remained in the business unit.