Download
1 / 18
180 likes | 183 Views
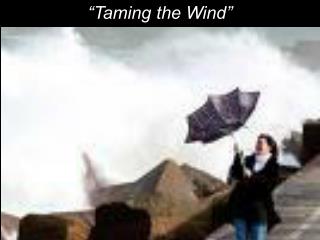
Taming the Indian Duck. Presentation to The Future Is Now conference Hyderabad, India 24 June 2016 Bentham Paulos, Principal PaulosAnalysis.com. Overview. Impact of variable generation: wind & solar Concept of “net demand”: demand minus wind & solar

E N D
Taming the Indian Duck Presentation to The Future Is Now conference Hyderabad, India 24 June 2016 Bentham Paulos, Principal PaulosAnalysis.com
Overview Impact of variable generation: wind & solar Concept of “net demand”: demand minus wind & solar Best way to manage variation: collaboration
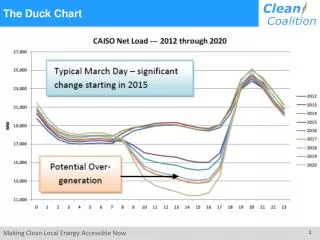
The Famous Duck Ramp! Conflict!
California Gross Demand Peak “Baseload” May 4-10, 2014
Peak California net demand “Baseload” 31% wind & solar May 4-10, 2014. 18% wind and solar overall
Peak With Wind & Solar Doubled “Baseload” 62% wind & solar May 4-10, 2014. If 36% wind and solar overall
The Future Is Now: Germany 79% renewable! Solar Wind Source: Agora Energiewende
Gross vs. Net Demand Peak Base Source: Agora Energiewende
The Future is Now: Denmark in 2007 Gross Net(wind)
Lessons Need less inflexible “baseload” and more flexible dispatchable plants, with lower turn down and ramping. Less need for energy, more for capacity and grid services. Big impact on revenues for generation. Thinner peaks make a variety of tools viable, not just generation.
Integration supply curve Regulatory changes are cheapest and fastest! Source: Clean Energy Ministerial
Benefits of coordination: US West Connect best renewable resources to load Reduce variability Share infrastructure to reduce cost: $1.5 billion per year by 2030 Improve reliability by sharing reserves and wires
Benefits of coordination: US West “Imbalance” market started 2014, still expanding Discussions of deeper integration: single regional energy market
Bentham Paulos ben@paulosanalysis.com +1-510-912-3001 @benpaulos PaulosAnalysis.com