Download

1 / 29
290 likes | 297 Views
Patterns of Delirium: Latent Classes and HiddenMarkov Chains as Modeling Tools. Antonio CIAMPI , Alina DYACHENKO , Martin COLE, Jane McCUSKER McGill University. BIRS, 11-16 December 2011. Outline . Introduction Basic Concepts Model and Estimation Results Conclusion. Introduction.

E N D
Patterns of Delirium: Latent Classes and HiddenMarkov Chains as Modeling Tools Antonio CIAMPI, Alina DYACHENKO, Martin COLE, Jane McCUSKER McGill University BIRS, 11-16 December 2011
Outline • Introduction • Basic Concepts • Model and Estimation • Results • Conclusion
Introduction State and course of a disease • A patient with a particular illness presents a number of symptoms and signs. The underlying clinical concept is that of disease state • As the illness evolves in time, the presentation may change. The underlying clinical concept is that of disease course • These concepts may be operationalized by measuring clinical indices. An example would be a one-dimensional severity index, usually measured on a continuous scale • More generally, one could use a multivariate index, reflecting a potential multidimensionality of the disease • In either case, a patient may be represented by a vector describing a curve in time y(t) • Can statistical learning method help discover patterns in this type of data?
Introduction Example: Delirium • Delirium is a disorder prevalent in hospitalized elderly populations characterized by acute, fluctuating and potentially reversible disturbances in consciousness, orientation, memory, thought, perception and behavior. • The Delirium Index (DI) is a clinical instrument which is used: • to measure the severity of delirium • to classify patients with delirium into clinicalstates • It consists of eight 4-level ordinal subscales assessing symptoms and sign of Delirium.
Introduction Delirium Index subscales • DI_1: Focusing attention • DI_2: Disorganized thinking • DI_3: Altered level of consciousness • DI_4: Disorientation • DI_5: Memory problem • DI_6: Perceptual disturbances • DI_7.1: Hyperactivity • DI_7.2: Hypoactivity
Introduction Note In this presentation we work with the multivariate DI only The univariate DI, defined as a sum of the subscales, represents the state of a patient as a continuous value. It is best modelled as a mixture of mixed regression models (for longitudinal data) Though less informative, this approach is more flexible, as it allows for continuous time, hence measuring times varying from patient to patient
Introduction Clinical states • Anticipating our results, we show here a graph representing 4 clinical states • These were empirically defined from a data analysis of 413 elderly patients at risk of developing delirium, some with some without delirium at admission • 225 of 413 patients (46%) have missing values • The analysis does not use the diagnosis, but only the subscales of DI • Delirium Index was measured at diagnosis, and at 2 and 6 months from diagnosis
Introduction 4 states of Delirium State 1 State 2 State 2 Low level of disorientation and medium level memory problems. No other symptoms. State 1 Low level of memory problems. No other symptoms. State 4 State 3 State 4 High level of focusing attention and disorganized thinking and medium level of altered levels of consciousness and low level of hypoactivity State 3 Medium levels of focusing attention, disorganized thinking and high level of disorientation and memory problems
Introduction Clinical course of delirium and Transitions observed in our data • The DI is routinely assessed at several points in time, in order to follow the clinical course of a patient 2 months later 6 months later at admission 20% 100% 39% 100% state 1 state 1 state 1 37% 95% 45% 87% state 2 state 2 state 2 42% 16% 79% 24% state 3 state 3 state 3 46% 35% 8% 21% 100% 11% state 4 state 4 state 4 38% • By clinical course we mean the sequence of transitions from one state to an other over time. Each patient has his or her own clinical course; however, we speak of ‘typical clinical courses’, meaning typical or common sequences of transitions
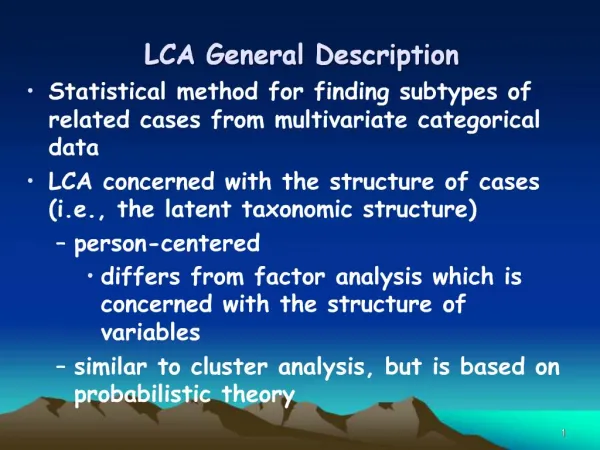
Introduction Defining clinical course: the statistical approach • Defining the clinical course of a disease is a very general problem in medicine and Epidemiology. Usually clinicians solve it on the basis of their experience • HOWEVER, appropriate statistical methods exist to help define clinical course directly from data • These statistical methods are latent class analysis especially in the more modern versions which include hidden Markov chains and other dynamical models • The rest of this presentation is devoted to explaining these notions in as an intuitive manner as possible
Basic Concepts Latent Class and Manifest variables DI 2 DI 7.1 DI 7.2 DI 1 Manifest variables Delirium Index … … Latent classes Delirium states Latent variable state 1 • If we knew the latent class, the description of the manifest variables is particularly simple • In the most classical definition of latent class, given the latent class, the manifest variables are assumed to be independent • We only need the univariate probability distributions to entirely describe the data, a major simplification! state 2 state 3 state 4
Basic Concepts Example • Consider a patient in clinical state (latent class) 1. Then we can calculate from the data that the probability of observing a low level of Disorientation is about 0.16 • Consider a patient in clinical state 2. Then the probability of observing a low level of Disorientation and a medium level of Memory problem are respectively: 0.28 and 0.30. The probability of observing both is 0.28*0.30 = 0.084 • Conversely, consider a patient with a high level of Disorientation and Memory problems but no other symptoms, then the probabilities that the patient is in states 1 to 4 are respectively: 0.003, 0.944, 0.053, 0.00 • Notice that these values are extracted from the data through latent class analysis.
Basic Concepts Markov Chains 2 months later 6 months later at admission • A patient is examined at different points in time. At each point in time he is in one of a number of possible states. For instance: one of the states of delirium described above. • A Markov Chain (MC) is a description of the evolution of a patient over time. It consists of a series of states and of a set of transition probabilities from one time point to the next. • In a MC, the probability of a transition in the time interval (t1, t2) is only influenced by the state of the patient at time t1. • A MC is stationary if the transition probabilities do not depend on time.
Basic Concepts Hidden Markov Chains at admission 2 months later 6 months later … … … … • In our case we do not have access to the state of the patient but only to the manifest variables from which we can extract the probability of the states. Thus our model will have to be of the form above. This is called a Hidden Markov Chain • Our analytic tools allow us to extract from the level of the manifest variables information, concerning the hidden level, e.g. • Probability to belong to a particular state at time t0 • Transition probabilities • We can also test stationarity of the transition probabilities
Model and Estimation Statistical model 1: simplified HMC model at admission 2 months later 6 months later … … … … Properties: • Each manifest variable depends only on the corresponding latent variable • Conditionally on the latent variables the manifest variables are independent (classical latent class definition) • Conditionally on the latent variables the manifest variables are independent (classical latent class definition) • Transition structure for the latent variables has the form of a first-order Markov chain
Model and Estimation Statistical model 2: Model that takes into account death and missingness at admission 2 months later 6 months later … … … DI1 DI8 • DI1 • DI8 • DI1 • DI8 T1 T2 T0 Assumptions: • Stationarity of transition probabilities • Homogeneity of the relationship between manifest and latent variables across times • Linearity in the latent variables • Additional assumptions of independence or dependence between latent variables and other indicator variables (ex., Death and Missingness) • D1 • D2 • Mis1 • Mis2
Model and Estimation Statistical model 3: Latent trajectory model at admission 2 months later 6 months later … … … … • Graph has two layers of latent classes • Lower level consists of one latent variable: its laten classes can be directly interpretable as distinct “courses” of the disorder
Model and Estimation Likelihood maximization • Likelihood maximization is based on the EM algorithm. The log-likelihood is ‘completed’ by assigning values to the hidden variables From Bayes Theorem:
Results Latent classes from Manifest variables with Death and Missingness information Model selection strategy: • determine the number of latent classes using statistical criteria like AIC and BIC (in our case we have 4 latent classes) • test the model’s assumption on missingness and death indicator: mutually independence and independence of all other variable in the model • test the model assumption of stationarity, homogeneity and linearity • examine more complex models
Results Dynamics through Hidden Markov Chain 2 months later 6 months later at admission state 1 state 1 state 1 20% 100% 100% 39% state 2 state 2 state 2 45% 87% 95% 37% 42% state 3 state 3 state 3 24% 46% 79% 16% 35% 21% state 4 state 4 state 4 11% 100% 8% 38%
Results DI distribution conditional on 4 Latent Classes
Results List of most probable courses with the a priori probability Course 1(22%): stable good state 1 Course 2 (4%) early improvement fair to good Course 3 (6%): late improvement fair to good state 2 Course 4 (23%): stable fair Course 5 (4%) early improvement poor to fair Disorientation=Low Memory problems=Medium Memory problems=Low Course 6 (6%): late improvement poor to fair state 3 Focusing attention= Medium; Disorganized thinking=Medium Disorientation=High; Memory problems=High Course 7 (12%) : stable poor state 4 Course 8 (4%): stable very poor 2 months later at admission 6 months later
Results Graphical representation of posterior probabilities of Latent Class
Example 1: Conditional Probability of Clinical Course given Clinical State at admission • Patient is in State 1 at admission: Course 1: stable good 0.97 • Patient is in State 4 at admission: Course 4: early improvement 0.30 Course 6 : early very poor to poor 0.15 Course 7 : late very poor to poor 0.08 Course 8 : stable very poor 0.29
Results Example 2: Predicting clinical course from manifest variables • Example 2: a patient has the following manifest variables at admission Focusing attention& Disorganized thinking = Medium Disorientation & Memory problem = High Hypoactivity = Low • Probability of each of the most probable course. Course 3 : early light improvement 0.26 Course 4: early improvement 0.08 Course 5 : stable poor 0.23 Course 6 : early very poor to poor 0.04 Course 7 : late very poor to poor 0.02 Course 8 : stable very poor 0.08
Results Example 3: Predicting clinical states from manifest variables • Example 3: a patient has the same manifest variables at admission as in previous example • Probability to be in state 1 or 2 or 3 or 4 at different time: 0.00 0.10 0.10 state 1 state 2 0.00 0.40 0.42 0.72 0.39 0.32 state 3 0.28 0.11 0.15 state 4 at admission 2 months later 6 months later
Conclusion Conclusion • We have shown that latent class analysis is a useful tool to extract information from clinical data • It provides means to obtain directly from data the key concepts of clinical state and clinical courseof a disease • It counts for realistic features of clinical studies eg: Death and Missingness. • We have shown how this applies in the case of Delirium • See: A. Ciampi,A. Dyachenko,M. Cole, J. McCusker(2011). Delirium superimposed on dementia: Defining disease states and course from longitudinal measurements of a multivariate index using latent class analysis and hidden Markov chains. International Psychogeriatrics.
Conclusion Future research • Inclusion of patient’s characteristics (covariates) • Improve tests of model fit • Develop non-stationary models • Develop mixtures of Hidden Markov chains (addition of another level of latent classes) • Develop latent trait models