Download
1 / 42
420 likes | 568 Views
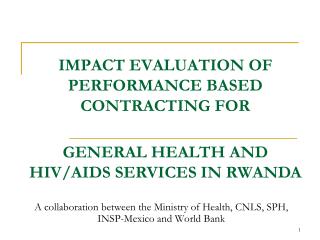
IMPACT EVALUATION OF PERFORMANCE BASED CONTRACTING FOR. A collaboration between the Ministry of Health, CNLS, SPH, INSP-Mexico and World Bank. GENERAL HEALTH AND HIV/AIDS SERVICES IN RWANDA. Presentation plan. Impact evaluation design Results from the general health baseline

E N D
IMPACT EVALUATION OF PERFORMANCE BASED CONTRACTING FOR A collaboration between the Ministry of Health, CNLS, SPH, INSP-Mexico and World Bank GENERAL HEALTH AND HIV/AIDS SERVICES IN RWANDA
Presentation plan Impact evaluation design Results from the general health baseline Follow up studies Discussion 2 8/24/2014
Study Rationale No examples of rigorously evaluated bonus payment schemes to public sector health care providers in developing countries No distinction between the incentive effect and the effect of an increase in resources for the health facilities Link between worker motivation programs and quality of care 4 8/24/2014
Hypotheses For both general health services and HIV/AIDS services, we will test whether PBC: Increases the quantity of contracted health services delivered Improves the quality of contracted health services provided Does not decrease the quantity or quality of non-contracted services provided, Decreases average household out-of-pocket expenditures per service delivered Improves the health status of the population 5 8/24/2014
Evaluation Design Make use of expansion of PBC schemes over time The rollout takes place at the District level Treatment and control facilities were allocated as follows: Identify districts without PBC in health centers in 2005 Group the districts in “similar sets” based on characteristics: rainfall population density livelihoods Flip a coin to assign districts within each “similar” to treatment and control groups. 6 8/24/2014
Roll-out plan Phase 0 districts (white) are those districts in which PBF was piloted Cyangugu = Nyamasheke + Rusizi districts Butare = Huye + Gisagara districts BTC = Rulindo + Muhanga + Ruhango + Bugesera + Kigali ville Phase 1 districts(yellow) are districts in which PBF is being implemented in 2006, following the ‘roll-out plan’ Phase 2 districts (green) are districts in which PBF is not yet phased in; these are the so-called ‘Phase 2’ or ‘control districts’ following the roll-out plan. According to plan, PBF will be introduced in these districts by 2008. 8 8/24/2014
Program Implementation Timeline 11 8/24/2014
Quality assurance in comparisons Law of large numbers does not apply here… Proposed solution: Propensity scores matching of communities in treatment and comparison based on observable characteristics Over-sample “similar” communities in Phase I & Phase II It turned out Couldn’t find enough characteristics to predict assignment to Phase I Took a leap of faith and did simple stratified sampling
More money vs. More incentives Incentive based payments increase the total amount of money available for health center, which can also affect services Phase II area receive equivalent amounts of transfers average of what Phase I receives Not linked to production of services Money to be allocated by the health center Preliminary finding: most of it goes to salaries
The baseline has 4 surveys General Health facility survey (166 centers) General Health household survey (2,016 HH) HIV/AIDS facility survey (64 centers) HIV/AIDS household survey (1994 HH)
Identified sectors and cells served by each of the 164 health facilities in the sample, Randomly selected four cells from the catchment area, For each cell, obtained number of zones (10-15 hh) Randomly selected three zones in each cell Obtained household lists for each of the zones Randomly selected one household for each zone Produced random sample of 12 households per health facility, with a final sample size of 2,016 households. General Health Household Level: Sampling Method 15 8/24/2014
Analysis Plan All analyses will be clustered at the district level Compare the average outcomes of facilities and individuals in the treatment group to those in the control group 24 months after the intervention began. Use of multivariate regression (or non-parametric matching) : control confounding factors Test for differential individual impacts by: Gender, poverty level Parental background (If infant : maternal education, HH wealth) 16 8/24/2014
Difference in differences models To test the robustness of the analysis Control sample (both observed and unobserved) heterogeneity A two-way fixed effect linear regression: 17 8/24/2014
General Health Centers Survey:Content All 166 centers in General Health General characteristics Human resources module: Skills, experience and motivations of the staff Services and pricing Equipment and resources Vignettes: Pre-natal care, child care, adult care VCT, PMTCT, AIDS detection services Exit interviews: Pre-natal care, child care, adult care, VCT, PMTCT
Prenatal Care: Provider Effort and Competence 8% Family history of genetic problems 13% Medicaments that is taking right now 17% 18% Lost/gain of weight, nausea, vomiting 21% 21% 85% Late menstrual dates 80% Number of previous pregnancies 85% 86% Number of previous miscarriages 64% 92% Effort Competence
Prenatal care:Provider Effort and Competence 93% Listen featal heatbeat 86% 61% Blood presure measured 81% 97% Abdomen examination 81% 17% Height measured 72% 19% Pelvicexamination 58% 83% Weight measured 52% Competence Effort
Socio-economic information Anemia finger prick test: children 12-71 months old Malaria dip stick test: children under age 6 Anthropometrics: <6 years old Mental health: mothers, pregnant women, adults over age 20 Sexual history and preventative behavior knowledge Pre-natal care utilization and results Parents or caretakers were asked for information regarding child (<5 years) health status General Health Household Survey: Content 30
Baseline Household Sample 2159 HH, 10,880 individuals Gender balance (49.3% male and 50.7% female) Average HH size is 5.71 individuals, Age range of <12 months to 96 years old. Half of the sample is below 12 years old 75% of the sample is under the age of 30 years old. (Sampling strategy)
Household Data: Child Recent Illness and Symptoms (<6 years)
Conclusion of the baseline studies • HH Results comparables to the recent DHS • Validity of samples • Of 110 key characteristics and output variables of HF, the sample is balanced on 104 of the indicators. • Of 80 key HH output variables, the sample is balanced on 73 of the variables. • Majority of the indicators which differ between Phase I and Phase II are results from patient exit interview, which is not a random sample.
Follow-up surveys • Early 2008 • 3 surveys: • Combined health facilities survey for General Health - HIV/Aids • Household survey for General Health – revisiting same households • Household survey for HIV/AIDS • Timing was key… • Ensure exposure to PBC for enough time • Avoid contamination (Training of phase 2 started after data collection for HF in May 2008)