Download
1 / 17
170 likes | 254 Views
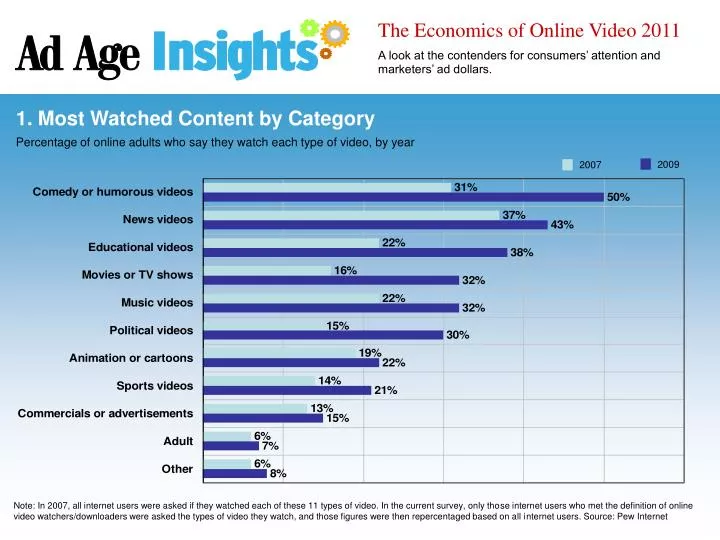
2009. 2007. The Economics of Online Video 2011 A look at the contenders for consumers’ attention and marketers’ ad dollars. 1. Most Watched Content by Category. Percentage of online adults who say they watch each type of video, by year.

E N D
2009 2007 The Economics of Online Video 2011 A look at the contenders for consumers’ attention and marketers’ ad dollars. 1. Most Watched Content by Category Percentage of online adults who say they watch each type of video, by year Note: In 2007, all internet users were asked if they watched each of these 11 types of video. In the current survey, only those internet users who met the definition of online video watchers/downloaders were asked the types of video they watch, and those figures were then repercentaged based on all internet users. Source: Pew Internet
PIPER JAFFRAY BARCLAYS CAPITAL eMARKETER FORRESTER RESEARCH The Economics of Online Video 2011 A look at the contenders for consumers’ attention and marketers’ ad dollars. 2. Video ad spending estimates 2010-2014 eMarketer is the most bullish on growth of online video ad market over next five years. $5.71 billion Source: Barclays Capital, eMarketer, Forrester Research, Piper Jaffray
The Economics of Online Video 2011 A look at the contenders for consumers’ attention and marketers’ ad dollars. 3. Top 10 Webisodes (1-5) For the month of October, 2010 Source: Visible Measures
The Economics of Online Video 2011 A look at the contenders for consumers’ attention and marketers’ ad dollars. 3. Top 10 Webisodes (6-10) For the month of October, 2010 Source: Visible Measures
The Economics of Online Video 2011 A look at the contenders for consumers’ attention and marketers’ ad dollars. 4. Online Video Consumption by Web Property Google Sites, driven primarily by video viewing at YouTube, ranked as the top online video content property in December. Note: Total U.S. home/work/university locations, Source: comScore
The Economics of Online Video 2011 A look at the contenders for consumers’ attention and marketers’ ad dollars. 5. Online Video Ad Consumption by Web Property Americans viewed 5.9 billion video ads in December, with Hulu generating the highest number of video ad impressions. Note: Total U.S. home/work/university locations. *Video ads include streaming-video advertising only and do not include other types of video monetization, such as overlays, branded players, matching banner ads, homepage ads, etc. **Indicates video ad network/server. Source: comScore
The Economics of Online Video 2011 A look at the contenders for consumers’ attention and marketers’ ad dollars. 6. Average Minutes per View by Day of Week The amount of time spent with online video increases on weekends across all media categories. Friday, Saturday had highest average minutes viewed across all media categories Source: Brightcove, TubeMogul
STREAMING VIDEO OTHER WEB TRAFFIC The Economics of Online Video 2011 A look at the contenders for consumers’ attention and marketers’ ad dollars. 7. Netflix Accounts for 21% of Internet Traffic at Peak Times North American downstream fixed-access peak hour share by application, September 2010 Streaming video up to ~37% of internet traffic during traditional “TV hours” Source: Sandvine; Mary Meeker, Morgan Stanley
The Economics of Online Video 2011 A look at the contenders for consumers’ attention and marketers’ ad dollars. 8. Total Minutes Streamed by Media Type In the third quarter of 2010, newspaper sites for the first time passed broadcast sites in total minutes streamed. Source: Brightcove, Tube Mogul
The Economics of Online Video 2011 A look at the contenders for consumers’ attention and marketers’ ad dollars. 9. Online Video Viewing The number of online videos watched has steadily increased in the last half of the year, peaking at over 35 billion. Number of videos in billions (000) 35,340,250 The number of videos watched by consumers grew steadily in second half of 2010. Source: comScore
The Economics of Online Video 2011 A look at the contenders for consumers’ attention and marketers’ ad dollars. 10. Viewing by Daypart Minutes spent by total internet audience watching online video by daypart Source: comScore
TV ONLY CROSS PLATFORM The Economics of Online Video 2011 A look at the contenders for consumers’ attention and marketers’ ad dollars. 11. Overlap in TV and Online Viewing TV-only viewers compared with cross platform viewers Source: comScore
NATIONAL SAMPLE, 980 YOUTUBE VIEWERS, 655 NEXTNEWNETWORKS, 1,516 Surf the Internet Use a computer for email, games, school or office work Do other things around my home Talk to others around me Talk on the phone Pay full attention to what I’m watching and nothing else The Economics of Online Video 2011 A look at the contenders for consumers’ attention and marketers’ ad dollars. 12. Concurrent Activities While Watching TV or Online Video What TV viewers usually do when watching television Source: Frank N. Magid Associates
NATIONAL SAMPLE, 980 YOUTUBE VIEWERS, 655 NEXTNEWNETWORKS, 1,516 The Economics of Online Video 2011 A look at the contenders for consumers’ attention and marketers’ ad dollars. 12. Concurrent Activities While Watching TV or Online Video What TV viewers usually do when ads air on TV Source: Frank N. Magid Associates
The Economics of Online Video 2011 A look at the contenders for consumers’ attention and marketers’ ad dollars. 13. Less Advertising Is Not a Driver of Online Video Watching Reasons to watch online Source: comScore
HALFWAY COMPLETED The Economics of Online Video 2011 A look at the contenders for consumers’ attention and marketers’ ad dollars. 14. Repurposed TV Ads vs. Web-Original Content Rank the Same Comparison of attrition rates -- percentage of people who viewed the video Source: Tube Mogul
NATIONAL WOV VIEWERS, 555 YOUTUBE VIEWERS, 722 NEXTNEWNETWORKS, 1,596 Web original programs provide quality entertainment whenever I want Web original videos keep getting better and better Many of the Web original videos online are good enough to be shown on television too I wish there were more Web original videos on the Internet I have certain Web sites I rely on for the best Web original videos online I'm always looking for new Web original videos to watch I think of Web original videos as the new TV The Economics of Online Video 2011 A look at the contenders for consumers’ attention and marketers’ ad dollars. 15. Consumer attitudes toward web original videos A majority of viewers agree that web original videos offer quality entertainment experience, on their terms Source: Frank N. Magid Associates