Download

1 / 32
320 likes | 327 Views
Consumption and The Multiplier. Outline. I. The consumption function Initial assumptions The pre-Keynesian consumption function The Keynesian consumption function Propensities to consume and save II. The Multiplier Brief history The Multiplier in action Multiplier and economic policy.

E N D
Outline I. The consumption function • Initial assumptions • The pre-Keynesian consumption function • The Keynesian consumption function • Propensities to consume and save II. The Multiplier • Brief history • The Multiplier in action • Multiplier and economic policy
Initial Assumptions - 1 • Two sector model of the goods market in the economy (no government sector, no foreign trade). • A closed economy: • in which households exercise consumption demand for final goods and services; and • Firms demand investment goods.
Initial Assumptions - 2 • In this economy AD C + I • Theories to explain how and why households and firms make consumption and investment decisions. • We will assume investment in the economy is given. • We need to introduce a theory to explain how consumption decisions are made by households.
The Pre-Keynesian Consumption Function - 1 • In microeconomic theory, when households have a large number of goods and services to choose from, an important variable influencing the demand for a specific good is its price relative to all other goods and services: Qd = f(P), ceteris paribus
The Pre-Keynesian Consumption Function - 2 • When we construct a macroeconomic consumption function, we take the relative price of goods as given. • We focus on how households divide their expenditure between consumption of all goods and services and saving. Y C + S
The Pre-Keynesian Consumption Function - 3 • Rewriting the identity, we can define planned savings as being that part of income which households do not intend to spend on consumption: S Y - C
The Pre-Keynesian Consumption Function - 4 • In the pre-Keynesian era, the predominant view was that the rate of interest was the main variable influencing the division of income between C and S. • The pre-Keynesian savings and consumption functions can be written as: S = f(r) C = f(r)
The Keynesian Consumption Function • Keynes accepted that the rate of interest was a variable which influenced consumption decisions, but he believed that the level of income was more important. C = f(Y) S = f(Y) • ‘The fundamental psychological law, upon which we are entitled to depend with great confidence . . . is that men are disposed, as a rule and on average, to increase their consumption as their income increases, but not by as much as the increase in their income’
The consumption function describes the relationship between consumer spending and income C = Ca + by • Consumption spending, C, has two parts: • Ca = autonomous consumption. This is the part of total consumption which does not vary with the level of income. • by = income-induced consumption. The product of a fraction, b, called the marginal propensity to consume (MPC) and the level of income, y. • The consumption function is a line that intersects the vertical axis at Ca. It has a slope equal to b.
Consumption function (Ca + by) Demand 0 Output, y The consumption function relates consumer spending to the level of income.
Consumption function (Ca + by) Demand Ca Output, y 0 The consumption function relates consumer spending to the level of income.
Consumption function (Ca + by) Demand Ca { autonomous consumption Output, y 0 The consumption function relates consumer spending to the level of income.
Consumption function (Ca + by) Demand slope b Ca { autonomous consumption Output, y 0 The consumption function relates consumer spending to the level of income.
The Consumption Function • Although output is on the horizontal axis, output and income in this simple economy are identical • Output generates income that is all received by households • As output rises by $1, consumption increases by the marginal propensity to consume (b) times $1
Marginal Propensity To Consume (MPC) - 1 • The MPC is always less than 1. • Suppose the MPC = .75 • An increase in income of $100 would increase consumption by by = .75 x $100 = $75
Marginal Propensity To Consume (MPC) - 2 • If a consumer receives a dollar of income, consumer will spend some of it and save the rest. • The fraction that the consumer spends is determined by the MPC • The fraction of income that the consumer saves is determined by the marginal propensity to save (MPS) • The sum of the MPC and MPS is always 1
Changes In The Consumption Function • The level of autonomous consumption and the MPC can change causing movements in the consumption function • If the level of autonomous consumption is higher, it will shift the entire consumption function. • Changes in the marginal propensity to consume will change the slope of the consumption function.
Autonomous Consumption Changes • Increases in consumer wealth will cause an increase in autonomous consumption. • Consumer wealth consists of the value of stocks, bonds and consumer durables. • Increases in consumer confidence will increase autonomous consumption.
Movements Of The Consumption Function Demand Ca1 Ca0 Output, y An increase in autonomous consumption from Ca0 to Ca1 shifts the entire consumption function.
Marginal Propensity To Consume Changes • Consumers’ perceptions of changes in their income affect their MPC • If consumers believe that an increase in their income is permanent, they will consume a higher fraction of the increased income than if the increase were believed to be temporary
Movements Of The Consumption Function Slope b1 Demand Slope b Output, y An increase in MPC from b to b1 increases the slope of the consumption function.
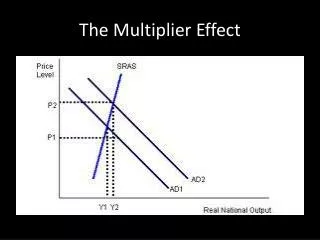
The Multiplier - Introduction • We now need to introduce the Multiplier theory and investigate in more detail the process by which income or output changes when an autonomous change occurs in any of the components of aggregate demand.
The Multiplier - Brief History1 • Concept first developed by Richard Khan. • Early theory was employment multiplier. • Keynes first made use of Kahn’s multiplier in 1933, when he discussed the effects of an increase in government spending of £500 (a sum assumed to be just sufficient to employ a man for one year in the construction of public works)
The Multiplier - Brief History - 2 • Keynes wrote: ‘If the new expenditure is additional and not merely in substitution for other expenditure, the increase of employment does not stop there. The additional wages and other incomes paid out are spent on additional purchases, which in turn lead to further employment . . . the newly employed who supply the increased purchases of those employed on the new capital works will, in their turn, spend more, thus adding to the employment of others; and so on’
The Multiplier - Brief History - 3 • By the time of the publication of the General Theory in 1936, Keynes had placed the multiplier at the heart of how an economy can settle into an underemployment equilibrium. • In the General Theory, Keynes focused attention on the investment multiplier, explaining how a collapse in investment and business confidence can cause a multiple contraction of output.
The Multiplier In Action - 1 • From this, it was only a short step to suggest how the government spending multiplier might be used to reverse the process. • Example: • Let’s assume that the MPC is 0.8 at all levels of income (MPS = 0.2) • Whenever income increases by $10, consumption increases by $8 and $2 is saved. • We assume that prices remain constant, and that a margin of spare capacity and unemployed labour exists which the government wishes to reduce.
The Multiplier In Action - 2 • Suppose the government increases public expenditure by $1 million, keeping taxation at its existing level. • The government could increase transfer payments. Alternatively, the government might wish to invest in public works or social capital (e.g. road construction).
Initial increase in income large • Households spend 0.8 of their increase in income on consumption ($800,000) • Further stages of income generation occur, with each successive stage being smaller than the previous one.
The Multiplier In Action - 4 • The eventual increase in income resulting from the initial injection is the sum of all the stages of income generation The value of the government spending multiplier = Change in income Change in government spending or k = Y G
The Multiplier In Action - 5 • Providing that saving is the only leakage of demand, the value of k depends upon the MPC. • The formula for the multiplier in this model is: k = 1 1 - b (where b = MPC) • The larger the MPC, the larger the value of the multiplier. • In our model, the value of the multiplier is 5 - an initial increase in public spending will subsequently increase income by $5 million.
Multiplier and economic policy • Implications are that it is possible to use discretionary fiscal policy to control or influence the level of aggregate demand. • Monetarists would dispute the beneficial effects - would point to the ‘crowding out’ effects of a widening budget deficit. • What is the evidence?