Download
1 / 24
240 likes | 246 Views
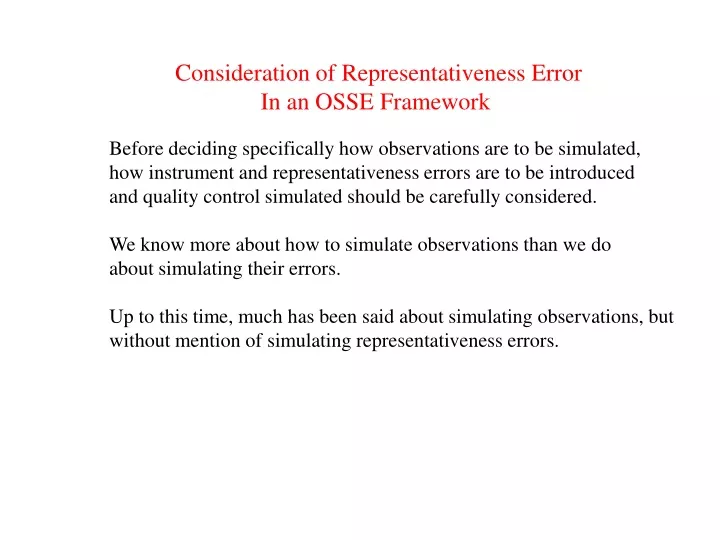
Consideration of Representativeness Error In an OSSE Framework. Before deciding specifically how observations are to be simulated, how instrument and representativeness errors are to be introduced and quality control simulated should be carefully considered.

E N D
Consideration of Representativeness Error In an OSSE Framework Before deciding specifically how observations are to be simulated, how instrument and representativeness errors are to be introduced and quality control simulated should be carefully considered. We know more about how to simulate observations than we do about simulating their errors. Up to this time, much has been said about simulating observations, but without mention of simulating representativeness errors.
Outline • What is representativeness error in reality? • How is rep. error manifest in the OSSE framework? • How should instrument and rep. errors be simulated? • How should gross errors be introduced?
Square roots of zonally averaged variances of analysis increments for OSSE and real analysis U wind From Errico, Yang, Masutani, Woollen (2006) 3 week average, 4x daily, for Feb. 1993 simulation of observing system
A Theory of Information (following Tarantola 1987) All information is most generally described in terms of PDFs Application of Bayes Theorem :
What is Representativeness Error ? • Representativeness error is a realization of the uncertainty in our • estimation (or ability to represent) an observation (a component of • y) given our representation x of the state x, i.e., due to the fact that • is not a delta function. • Representativess error has two primary sources: • 1. Our representation x of the state xdoes not fully describe all we • need to know about the atmosphere to determine y without • probable error (resolution is one such issue here). • Our representation of the relationship between some observations • (e.g., concerning radiances or precipitation) and the fields being • analyzed (e.g., T, q, etc.) is imperfect. • Both of these together can be called representation or modelization errors • if interpolation is essentially considered a model of spatial relationships.
A more common description of rep. error yt - H(xt) = e • This explicitly refers to a model H rather than a more general • pdf relating y to x. • Mathematically, this is essentially a transformation of variables, • with a pdf now required to describe the errors. • Note that y here refers to a perfectly measured value of an observation • so that e does not include instrument error
Assumption of Gaussian Error Statistics In the last expression, we are assuming that the representativeness errors are unbiased Gaussian, or equivalently that given x the possible y have a Gaussian distribution with mean (or equivalently, expected value) H(x).
Results for Gaussian Error Statistics They add !
Lorenc and Hammon 1988 Assimilation of scalars with Gaussian errors For scalar y and x In all cases, the analyzed mode is between those for the observation and background, and the analsyis variance is less than those of both observation and background.
Illustrative example from Tarantola 1987 (Fig 1.10, page 54)
Comparison of AIRS forward models w.v. continuum CFCs From R. Saunders
Spectra of old ECMWF nature run on eta=0.7 surface k-3 Nature run k-8 Est. anal. error From Errico, Yang, Masutani, Woollen (2006)
Lorenc and Hammon 1988 Assimilation of scalars with Gaussian + gross errors Values in the tails of the observation pdf are here much larger than in the Gaussian case. When the observed value becomes far from that of the background, the most likely analyzed state therefore becomes close to the background.
Real Error Characteristics • Some characteristics are non Gaussian • Biases are non-negligible • Statistics are strongly state dependent • For many useful instrument types, representativeness, • instrument, and related background errors all have similar statistics. • It is difficult to recognize all the detailed ways that errors enter • It is nearly impossible to quantify the statistics of each distinct • contribution to the net error
Example of Forward Model Error: Errico et al. QJRMS 2001 6-hour accumulated precip. With 3 versions of MM5 Contour interval 1/3 cm Kain - Fritsch Betts - Miller Grell
Simulation of observations • Define set of observation types • Define how to choose observation locations (e.g., cloud track winds • only where there are nature-run clouds and cloud-cleared radiances • only where it is clear (?), which may not work!). • Interpolate N.R. state to observation locations • Apply forward observation operators (e.g., RT model) • Apply spatial or temporal integration operators (?) • Add observation plus representativness errors • Add gross errors The details of how one step is performed may determine options for how other steps are performed and necessarily affect quantitative parameters used in subsequent steps.
Components of the operator H H(x) = S {H*[I (x)]} I = Possible spatial and temporal interpolation operator H* = Observation operator (RT model, precipitation scheme, et al.) S = Possible spatial or temporal integration operator (e.g., to obtain line of sight or footprint integrals or averages)
Different ways of simulating error Simulating error as difference between 2 observation operators: ΔH(x) = HA(x) - HN(x) These errors are therefore have a systematic characteristic Simulating errors as a random variable: ΔH(x) = ε These errors are therefore have a stochastic characteristic Real errors ΔH(x) = HA(x) - HR(x) = ? These errors likely have both systematic and stochastic characteristics
Two Approaches to Simulating Errors • Model errors based on what we think we know about such errors. • a. Must have good idea of error characteristics • b. Must account for errors already introduced • c. Must tune results • Add errors so that OSSE innovation statistics match REAL ones • a. Must match means and variances of O-F: • b. Must simply but essentially tune all errors simultaneously • c. Matching of analysis increment statistics also likely • d. Can include state dependence (although new stats. required) • e. Assumes background errors same in OSSE and real system • f. Is there any reason to use different forward models?
3 options for simulating gross errors • Present method in the NCEp OSSEs is to copy quality control • flags from corresponding real data. • a. Acceptance rates in OSSE and Real analysis identical • b. Locations of observations inconsistent with simulated flow • Use PDF for statistical model of simulated errors model that includes • a gross error component following Lorenc and Hammon 1988 • Add a large fixed error to a randomly determined but specified • percentage of observations. • a. Acceptance rates in OSSE and Real analysis identical • b. Must specify a selection algorithm
Recipe for simulating instrument and representativeness errors 1. Determine real analysis innovation means and variances for: a. different observation types and possibly subtypes b. different seasons c. different geographic or synoptic locations (more difficult) 2. Create all simulated observations without added simulated error 3. Make initial guess about the statistics of missing error 4. Add errors to all observations by drawing random values from some pdf 5. Assimilate all observations (with errors) 6. Compute OSSE innovation statistics as in 1 7. Modify missing error statistics and repeat 4-7 as needed 8. Check simulated forecast scores and perform validating OSEs 9. Modify error stats or observation simulations as needed for 8
PDF for random errors Details Missing Here Need mean, variance, and prob. of gross error Use truncated gaussian for the non-gross part Need algorithm for gross error (random or situation dependence; individual or groups of related obs)