Download
1 / 18
180 likes | 292 Views
Science and Science Reasoning. Scientists claim to study objective facts. They only study questions for which observable data will provide the answer. What is an example of a question for which observable data will not provide the answer? Consider these questions:

E N D
Science and Science Reasoning Scientists claim to study objective facts. They only study questions for which observable data will provide the answer. What is an example of a question for which observable data will not provide the answer? Consider these questions: Is basketball more interesting than baseball? Is it wrong to tell a small lie to avoid hurting someone's feelings? What is the best age at which to get married? In order to answer these questions you might make use of some observed facts about the world. But it is not easy to see what facts in the world would provide a definitive answer. The above questions would be considered unscientific. (Which is not to say the questions are uninteresting).
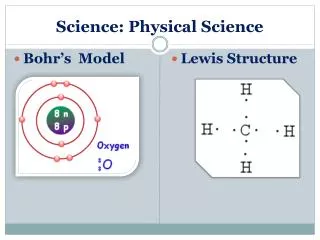
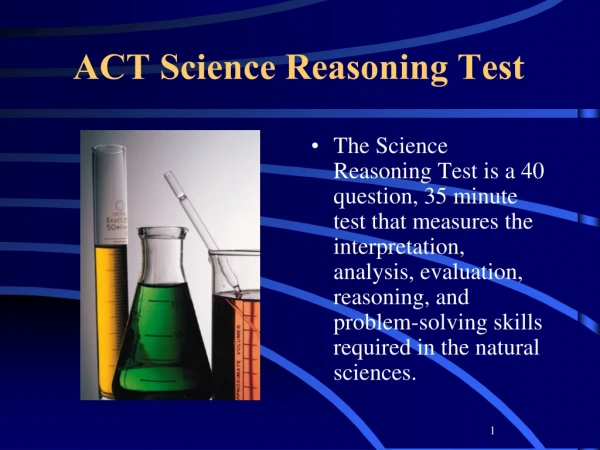
Quantification: Scientists put numbers on things. They count and measure objects and events. Because they present their findings as numbers, one of the most important scientific skills is the ability to think quantitatively. The math is usually not too difficult; you just have to be comfortable with extracting and interpreting information from tables and graphs. You will see questions from the following domains: physics, Earth/space sciences, biology and chemistry. Remember that this doesn't mean you need to know much about these things, you just want to be comfortable reading about them. You will see three main types of questions: data representation, conflicting viewpointsand experiment(research) summaries.
The 4-Step Approach to Taking the ACT Science Reasoning Test 1. Skim and Identify the passage 2. Read the question and all the answers 3. Eliminate answers which are obviously incorrect. 4. Choose the correct answer from the remaining choices
Passage Types – Data Representation These passages are about graphs, tables and figures. You need to know how to interpret the data that is represented. BTW you will also see data given in other types of passages as well. Variables: In most experiments there are 2 types of variable. The Independent (manipulated) Variable and the Dependent (response/measured) Variable. Let’s practice 5 groups of rats are fed identical diets except for the amount of Vitamin A that they receive. Each group gets a different amount. After 3 weeks the rats are weighed to see if the amount of Vitamin A received has affected their weight. IV = DV = weight Amount of vitamin A More bushels of potatoes will be produced if the soil is fertilized more. IV = DV = Amount of fertilizer Bushels of potatoes
Students in a science class carried out an investigation in which a flashlight was pointed at a screen. They wished to find out if the distance from the light to the screen had any effect on the size of the illuminated area. IV = DV = Size of illuminated area Distance to the screen Will corn seeds sprout at different times depending on the temperature of the water in which they are placed? IV = DV = Time for corn seeds to sprout Temperature of water Will the number of nails picked up by an electromagnet be increased if more batteries are put in the circuit? IV = DV = Number of nails picked up Number of batteries in circuit
Graphs Graphs are a big part of the ACT science reasoning section. Not only are they prominent in the Data Representation questions, they are often found in experiment summary and conflicting viewpoint passages. It is extremely important to be able to read, interpret and analyze graphs. The most common type of graphs that appear on the ACT is line graphs. These will be plotted against 2 labeled axes (usually DV vs. IV) and do not include detailed information. Take a look at Graph A (#1 on your sheet). Graph A is a line graph that shows the relationship b/w gas volume (vertical axis) and gas temperature (horizontal). What is that relationship? The graph shows that as the temperature increases, the volume increases (and vice-versa) and that the relationship is linear.
Now look at Graph B (#2). It is also a line graph, but is it he same as A? Graph B shows the relationship b/w time of day and shadow length and that relationship is linear, but negative; the opposite of that in A. We call the relationship inverse. That is, as the time goes from sunrise to noon, the shadow length gets smaller. As you can see from Graph C (#3), not all relationships are linear. Do your best to answer the following questions about the graph. What is the independent variable? The dependent? In general, what is the relationship b/w temp of a substance and its pressure? The relationship b/w temperature and pressure is linear for which substance? For which substance does an increase in temp produce the most significant pressure increase? The least significant?
Still graph C A substance will boil when its pressure is equal to standard atmospheric pressure. Use the graph to estimate the boiling points for ether and ethanol. What you just did is called interpolation: Determining a new value for the DV, from new value of the IV – within the range of the data. What about the bp for glycerol; can it be determined? Is there a way to estimate it? This is called extrapolation – that is, the new values are outside the region of the data. Which substance has the highest bp? The lowest? Identify the pressure for each of the 4 substances at a temperature of 70 0C: Ether ≈ 1700 mmHg Ethanol ≈ 550 mmHg Water ≈ 250 mmHg ≈ 10 mmHg Glycerol For which value(s) did you have to interpolate or extrapolate?
Not all graphs on the ACT are line graphs. One other type that show up are bar graphs. This type of graph represents information by the length or height of a bar. Look at Graph D (#4) for example. What information is presented? Air and water temperature in a specific location for seven different times of the day. Answer the following questions about Graph D: At which time is the difference between the air and water temperature the greatest? According to the graph, what is the water temperature when the air temperature is 69 0F? Which sequence of times shows the 4 highest in order from greatest to least? Based on the graph, what was the likely air temperature at 11:30 a.m. 4 p.m. ≈ 72 0F 1 p.m.; 2 p.m.; 12 noon; 3 p.m. ≈ 70 0C
Tables and Figures There can be some fairly involved tables and figures on the ACT. The secret, don’t spend much time looking carefully until you know what the question is. Scan the table or figure quickly so that you have an idea what it contains, then read the question. Go back to the table or figure and just look for the information you need to answer the question. Do not waste time analyzing tables and figures before you know what the questions are!!! Answer the following questions on your handout: Summarize the change in water depth from all sampling sites from January to April. All sites show at least some increase. A and B2 are larger than the others, B3 is much larger. What is the difference between the January and November water depths at the dam? 8.6 – 8.6 = 0 What is the best explanation for the water depths recorded at location E? Location E is the dam. Water depths remain nearly constant. A likely explanation is that if the water level starts to approach 9 m it flows over the dam.
Research Summaries • Research summary questions are based on descriptions of experiments and usually contain graphs, tables and/or figures. • Use the same 4 step strategy to answer questions as with Data Representation, except include the following as part of step 1: • What is the research design? • Experiment – involves independent and dependent variables, controls and data collection/analysis • Observation – measurements of existing situations (plant growth vs. rainfall) • Correlation – relationship b/w variables (0→1); not the same as cause and effect • What are the variables? • What are the controls? • What are the results? For sample Passage I: Look at the two experiments. For each experiment identify the IV, DV any controls used and the results.
Research Summaries Answers for Passage I: Experiment 1Experiment 2 IV amount of food supplement % of food supplement DV # of calories weight gain Controls Type of food food supplement dogs? Essentially identical dogs
Test Prep ACT Science Reasoning Quiz What are the 4 steps in the 4 step approach to taking the Science Reasoning portion of the ACT? Name one of the 3 passage types that are on the test What is one type of research design that is presented on the exam? There are 3 things you should identify as part of Step 1 when analyzing a research design. Name 2 of them. True/False – You will need to be able to interpret graphs when you take the test. True/False – There will not be any pictures or diagrams to evaluate on the test.
Test Prep ACT Science Reasoning Quiz What are the 4 steps in the 4 step approach to taking the Science Reasoning portion of the ACT? Skim the passage; read question and answers; eliminate obvious wrong answers; choose the correct answer Name one of the 3 passage types that are on the test. Data representation; research summaries; conflicting viewpoints What is one type of research design that is presented on the exam? Experiment; observation; correlation There are 3 things you should identify as part of Step 1 when analyzing a research design. Name 2 of them. What are the variable, controls and results True/False – You will need to be able to interpret graphs when you take the test. Extremely true True/False – There will not be any pictures or diagrams to evaluate on the test. Extremely false
Conflicting Viewpoints • Conflicting viewpoint questions are based on passages which present hypotheses, viewpoints, or ideas are mutually exclusive. That means that the hypotheses or viewpoints cannot both be correct, in fact they might both be incorrect. They will not ask you to choose which one is correct. • Use the same 4 step strategy to answer questions as with the other 2 types, except include the following as part of step 1: • What is the fundamental issue? • What is the position of each scientist? • What points does each scientists use to support his/her position? • What flaws are there in each scientist’s position?
Conflicting Viewpoints Answer the questions in Sample Passage I, but first write down the answers to the 4 questions beneath the viewpoint for Scientist #2. • What is the fundamental issue? • Does the earth have a primary or secondary atmosphere? • What is the position of each scientist? • Scientist #1: primary Scientist #2: secondary • What points does each scientists use to support his/her position? • Scientist #1: First cells (anaerobic prokaryotes) formed in ocean. Gravity holds atmosphere close to the surface. • Scientist #2: First cells, no oxygen. Research shows amino acid and probably life can form with no O2
What flaws are there in each scientist’s position? • Scientist #1: No absolute proof. No explanation for why first cells were anaerobic even though oxygen is abundant. The link between gravity holding the atmosphere and organisms needing oxygen is not explained. • Scientist #2: No absolute proof.
Instructions for Logging in to Complete the Practice Science Reasoning Test Find a computer that works, has battery power and will let you log on. Type in www.number2.com Select New Users – Enroll Now. For coach email include eaappier@smsd.org Select ACT. Select Science Reasoning. Select the test, you may go through the tutorial (or any other parts of the web site) later. When you have answered the 20 questions and it says “Done”, let me see your screen. Put the computer back in the correct slot and make sure it is plugged in. Please remain quiet while others are trying to finish!