Download
1 / 52
530 likes | 725 Views
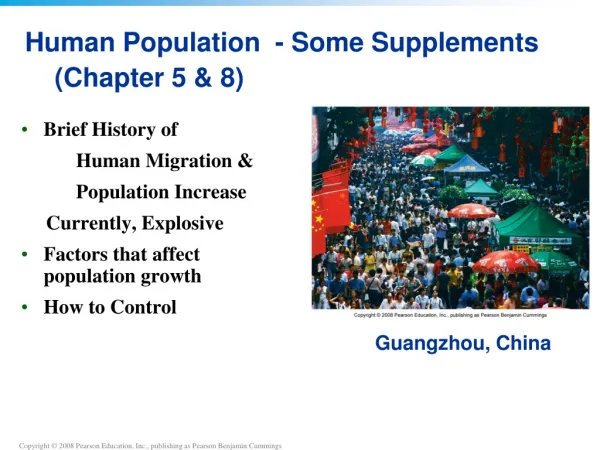
Chapter 8 Human Population. Mr. Manskopf Notes also at http://www.manskopf.com. Chapter 8 Big Idea. The size and growth rate of human population has changed drastically over the last 200 years. Those changes have led to profound changes to almost every place on Earth.

E N D
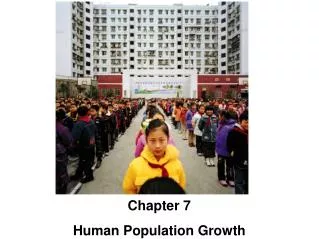
Chapter 8 Human Population Mr. Manskopf Notes also at http://www.manskopf.com
Chapter 8 Big Idea • The size and growth rate of human population has changed drastically over the last 200 years. Those changes have led to profound changes to almost every place on Earth.
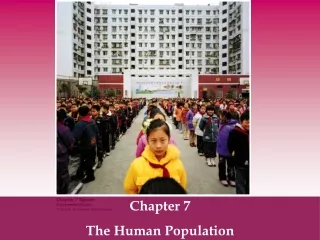
Talk About ItIs it ethical for governments to limit or encourage human population growth? China’s One-Child Policy • In 1970, the average Chinese woman had about six children. • Since 1979, China has used a system of rewards and punishments to enforce a one-child limit to slow population growth. • In 2005, there were 32 million more males than females in China under the age of 20
Studying Human Populations • Describe how the size and growth rate for human population has changed over history • What factors lead to population changes • Analyze populations using Age Structure Diagrams • Terms: Demography, Age Structure, Survivorship, Fertility, Migration, Life Expectancy
Describe what you see on this graph • How long did it take to get to 1 billion, than 2, 3,4,5,6 • How many people are living today? Did You Know?Basic sanitation was rare even in the medical profession until 1861, when Dr. IgnazSemmelweis discovered that doctors’ hand washing greatly reduced patient mortality.
Why did it take so long to reach 1 billion? • Why do you think it took off around the late 1880s? Interesting Fact: Of all the humans ever born, approximately 6-7% are alive today.
Studying Human Populations • Demography: the study of human population • How many people live where? • How long are you expected to live? • How many children are you likely to have.
Demography • Population size: Number of people • Population density: Number of people living per mi2 (or per km2) • Population distribution: How people are distributed within an area
Exponential Growth Exponential Growth: rapid growth often seen as J-Shaped curve on a graph Can that growth continue?
Forecasting Population Size • Will new schools be needed? • Should we be building more housing? • Should farming practices be improved? • Predictions like this often wrong because human behavior changes
Forecasting Population Size • Age Structure: the distribution of ages in a population • Age Structure Diagrams aka population pyramids • What is useful about these diagrams?
What are these age-structure diagrams showing? • What are the “reproductive years” Why is that important in forecasting future population growth?
Which “type” of countries are going to see most of the population growth? • Which “type” of countries do people live longer lives? • Survivorship: percent of population likely to survive a given age
What causes population to rise? Population Changes = (births + immigration) – (deaths + emigration) For world population growth we are only concerned about births and deaths.
Fertility Rates • Fertility Rates: number of babies born each year per 1,000 women • Total fertility rate • Replacement rate fertility
Fertility and Women • Two main factors impact fertility rates worldwide • Education level of women (knowledge of family planning) • Economic level of women Generally, on average, more education, more wealth = lower fertility rates
What does this graph show? • How has U.S. fertility rates changed?
Population Change = (births + immigration) – (deaths + emigration) • Migration: movement INTO (immigration) or OUT of (emigration) an area U.S. growth continues because of both births and immigration
Population Change = (births + immigration) – (deaths + emigration) • Death rates on the decline… people living longer • Why? Better hygiene, sewage disposal, clean water, medicines, education, access to food, nutrition
Life Expectancy • Life Expectancy: average number of years members of a population are expected to live • Improvement in most of world • Lower INFANT MORTALITY
Demographic TransitionEvery Country Goes Through It Explain what you see on this chart
Stage 1 : High Birth AND Death rates = little population change • Stage 2 : Death Rates Fall, Birth Rates Still High = Population Growth • Stage 3: Death Rates Low, Birth Rates Drop = Population Growth Slows • Stage 4: Death Rates Low, Birth Rate Low = Population Declines DESCRIBE EACH STAGE: WHAT DO YOU SEE?
Calculations • A town currently has a population of 20 people. If 10 people are born, 8 people die, 3 immigrate and 1 emigrate, what is the population?
Calculations • USA currently has a population of 320,000,000 people. If 5,000,000 people are born, 2,000,000 people die, 200,000 immigrate and 50,000 emigrate, what is the population?
Rule of 70: Doubling Time • Currently, a city has a population 10 million. When will it reach 20 million if the population is growing at 10%? • How long will it take a population to go from 200 to 400 if it grows at 5% a year?
Review • Describe how the size and growth rate for human population has changed over history • What factors lead to population changes • Analyze populations using Age Structure Diagrams • Terms: Demography, Age Structure, Survivorship, Fertility, Migration, Life Expectancy
Male Female Rapid Growth Guatemala Nigeria Saudi Arabia Slow Growth United States Australia Canada Zero Growth Spain Austria Greece Negative Growth Germany Bulgaria Sweden Ages 0-14 Ages 15-44 Ages 45-85+ Population Age Structure Fig. 10-14 p. 184
Population Trends • What are problems associated with rapid human population growth? • Compare developed and developing (lesser developed) countries. • Investigate strategies for reducing population growth. • Terms: arable land, urbanization, suburban sprawl, developed and developing countries.
Problems With Rapid Growth Lack of infrastructure to support population • Water supplies • Sewers • Roads • Schools • Powerplants • Hospitals • Housing
Problems With Rapid Growth Using up resources too quickly • Water supplies • Food Supplies, Vegetation • Wood/fuels : wood supplies critical to life in many regions
Problems With Rapid Growth Unsafe water supplies • Sewage mixing with water supplies • Cholera, Dysentery, Typhoid • 1 Billion lack clean water • 3 million/yr die
Clean Water Lacking If the millions of women who haul water long distances had a faucet by their door, whole societies could be transformed.
Problems With Rapid Growth Land becomes scarce • Arable land : land that can grow crops • Tradeoffs made : agriculture, housing, natural habitats • Which do you think typically wins out?
Problems With Rapid Growth Urbanization: movement of people from rural areas to cities • Much of world is going through • Increased demand on infrastructure
Problems With Growth In U.S. Suburban sprawl: work in cities live in suburbs • Decay of inner cities • Increased traffic • Loss of farmland • Decreased wildlife habitat
Diverse World Population Developed Countries • US, Canada, Japan, Australia, New Zealand and most of Europe. High Per Capita GDP. (1.2 billion people)
Comparing a developed country to Moderately Developed to Developing (lesser developed) Did You Know?On average, 1 American consumes as much natural resources as 5 Chinese or 13 Pakistanis.
Diverse World Population • Developing (lesser developed) • 5.2 billion people • living with very little • 97% of population growth.
Percent of World’s 19 Population 81 0.1 Populationgrowth 1.6 85 Wealth andincome 15 88 Resourceuse 12 75 Pollutionand waste 25 Developedcountries Developingcountries
Strategies for Controlling Growth • Public Advertisements • Economic Incentives • Legal Punishments • Empowering Women • Investments in Education and Family Planning