Download
1 / 24
250 likes | 412 Views
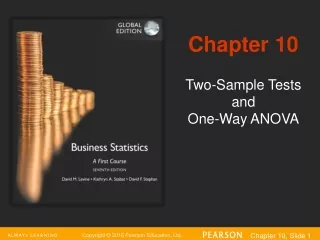
Part II: Introduction to Hypothesis Testing. Chapter 9 Two-Sample Tests. Renee R. Ha, Ph.D. James C. Ha, Ph.D. Integrative Statistics for the Social & Behavioral Sciences. Paired t test. Also called Correlated Groups t test. Paired t test. Use when:

E N D
Part II: Introduction to Hypothesis Testing Chapter 9 Two-Sample Tests Renee R. Ha, Ph.D. James C. Ha, Ph.D Integrative Statistics for the Social & Behavioral Sciences
Paired t test • Also called Correlated Groups t test
Paired t test • Use when: • You have two measures on the same subjects (“before” and “after” measures are common). • You have two separate samples but the subjects in each are individually matched so that there are similar subjects in each group (but not the same subjects in each group).
Tables 9.1 & 9.2 • Table 9.1: An example of “before” and “after” pairing using the same subjects in each “paired” sample • Table 9.2: An example of a “paired” design in which the actual subjects in each sample are different but are “matched” for characteristics which they have in common (in this example, genetics)
t-Test: Paired Two Sample for Means • Results if you use Microsoft Excel to calculate the t-test
Paired Samples Test • Results if you use SPSS to calculate the t-test
t-Test: Paired Two Sample for Means • Results if you use Microsoft Excel to calculate the t-test
Paired Samples Test • Results if you use SPSS to calculate the t-test
When to use Paired t test 1. You have two samples and a within-groups design. 2. The sampling distribution is normally distributed. 3. The dependent variable is on an interval or ratio scale.
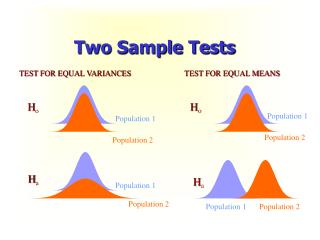
Independent t test • Two completely different (independent) groups of subjects that you want to compare to determine if they are significantly different from one another: a between-groups design. • E.g. Experimental and control conditions. • Compare the means of the two conditions/groups.
Independent t test • Sampling Distribution of the Difference between sample means. • Determining variance when you have TWO estimates.
t-Test: Two-Sample Assuming Equal Variances • Results if you use Microsoft Excel to calculate the t-test
Independent Samples Test • Results if you use SPSS to calculate the t-test
t-Test: Two-Sample Assuming Equal Variances • Results if you use Microsoft Excel to calculate the t-test
Independent Samples Test • Results if you use SPSS to calculate the t-test
When to use Independent t test 1. Two samples and a between-groups design. 2. The sampling distribution is normally distributed. 3. The dependent variable is on an interval or ratio scale 4. The variances of the two groups are the same or are homogeneous.
HOV The homogeneity of variance assumption (HOV) requires that the variances of the underlying populations are equal or, in practical terms, not significantly different from one another.