Download
1 / 19
190 likes | 262 Views
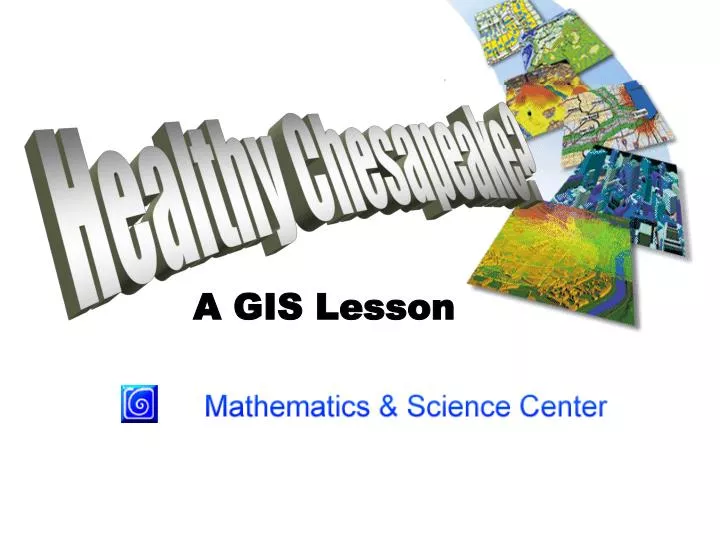
Healthy Chesapeake?. A GIS Lesson. W hat is a Watershed?. +15 Million People. The area of land where all of the water that is under it or drains off of it goes into the same place. W hat is an Estuary?. A semi-enclosed body of water that has a free connection with the open

E N D
Healthy Chesapeake? A GIS Lesson
What is a Watershed? +15 Million People
The area of land where all of the water that is under it or drains off of it goes into the same place.
A semi-enclosed body of water that has a free connection with the open sea.
What ways do you think scientists monitor the health of a bay or estuary?
The Environmental Protection Agency monitors watersheds across the United States.
Two categories by which they characterize a watershed are: 1. Quality 2. Vulnerability
7 QualityIndicators Rivers, Lakes, and Estuaries Meeting All Designated Uses Fish Consumption Advisories Indicators of Source Water Conditions Contaminated Sediments Ambient Water Quality Data (Toxic) Ambient Water Quality Data (Conventional) Wetland Loss Index
8 VulnerabiltyIndicators Aquatic / Wetland Species at Risk Pollutant Loads Discharge (Toxic) Pollutant Load Discharge (Conventional) Urban Runoff Potential Agricultural Runoff Potential Population Change Hydrologic Modification Estuarine Pollution Potential
We have the data… But is there any easier way to analyze it?
To visualize the data we will use a web-based GIS application or a free viewer called ArcIMS.
Either of these applications can take lots of data… …and tie it to a map.
With GIS you can combine layers of information about a placeto give you a better understanding of that place
How healthy do you think is the Chesapeake Bay Watershed? Lets use GIS to take a look at the data.
Now use your worksheet titled ‘Health of the Chesapeake Bay Watershed’ to help you analyze the data.
Go to this website: http://mathsciencecenter.info Click on ‘Lessons on the Web’
Click on ‘Applications’ and then click on your lesson.