Download
1 / 23
230 likes | 308 Views
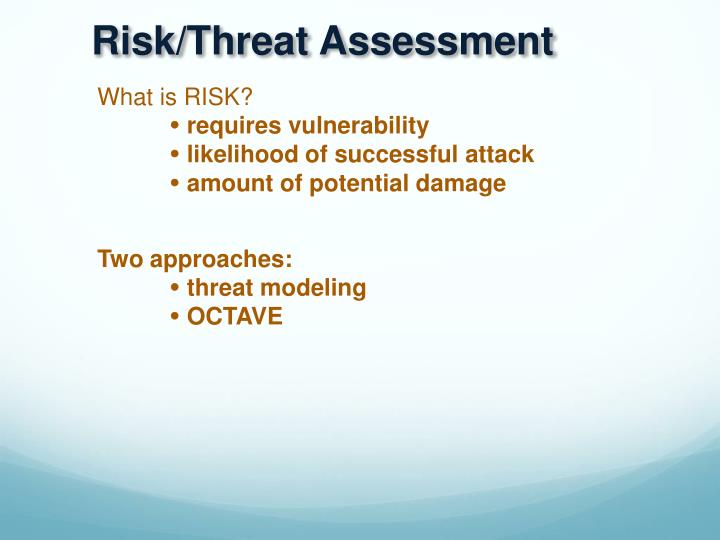
Risk/Threat Assessment. What is RISK? requires vulnerability likelihood of successful attack amount of potential damage. Two approaches: threat modeling OCTAVE. Threat Modeling (part of Microsoft ’ s Trustworthy Computing). ______.

E N D
Risk/Threat Assessment What is RISK? requires vulnerability likelihood of successful attack amount of potential damage Two approaches: threat modeling OCTAVE
Threat Modeling (part of Microsoft’s Trustworthy Computing) ______ potential & cost of harmful event/attack is realized by an… ______ that occurs due to a… __________ that should be mitigated by a… ____________
Threat Modeling (part of Microsoft’s Trustworthy Computing) Why? The Players • Customers • Business Analysts • Software architects • Developers • Testers
Step 1: Identify Security Objectives Identify the system assets. Focus on confidentiality, integrity, availability. What can we prevent? What do we care about most? What is the worst thing that can happen? What laws and regulations apply?
Step 2: Describe System Architecture Ways to depict software architecture: _____ Diagram __________ Diagram
Class Diagrams A picture depicting classes and interconnections. Basic Notation Simple Example
Data Flow Diagrams A picture depicting how data flows within a software system. Basic Notation Simple Example
DFD Rules 1) Every process is labeled with a _____ phrase. 2) Every data flow is labeled with a ______ phrase. 3) Sources, sinks and data stores are named with _____ phrases. 4) Every process must have at least one entering and one exiting data flow. 5) Data stores cannot connect to each other without intervening processes.
Step 3: Decompose app Drill down to details of software architecture: Class Diagram include methods, packages, inner classes include files, external calls & parameter lists Data Flow Diagram processes expanded into other processes and flows _____________
Data Flow Example 3 Email System DFDs are usually constructed via refinement. This is a possible Level 0 DFD.
Data Flow Example 3 cont'd This is a possible Level 1 DFD.
Example 3 Edit zoom This is a possible Level 2 refinement.
Step 4: Identify Threats This requires a systematic approach: 1) look at detailed design for… trust boundaries entry points exit points 2) use a classification framework like STRIDE _________(authenticity) _________(integrity) _________ _________ disclosure (confidentiality) _____ of service (availability) ________ of privilege (authorization) http://msdn.microsoft.com/en-us/magazine/cc163519.aspx
Data Flow Example 3 …again
Attack Trees Attack trees (also called threat trees) describe the nature of an attack. Drawing attack trees helps with understanding, discovering, and mitigating threats. Notation • A tree • root is the goal for the attack • children (of a node) define methods to achieve parent • children may be ORed or ANDed http://www.schneier.com/paper-attacktrees-ddj-ft.html
Step 5: Rate Threats Develop a systematic approach: start with an accepted approach adjust weighting with experience Two possible approaches Risk = Threat X Asset DREAD
Risk = Threat X Asset The basic formula: Risk = Threat probability * Damage potential Threat probability accounts for exploitability & mitigations. Damage potential is basically the cost or impact. Ranges? numbers might be difficult to use categories (3 to 5) is usually sufficient
DREAD (Microsoft’s first model) Damage potential How much damage will the exploit produce? Reproducability How likely is it for the attack to recur? Exploitability How easy is it to carry out the attack? Affected users What fraction of users will be affected? Discoverability What are the odds an attacker can find the vul? Risk = min(D, (D+R+E+A+D)/5)
Problems with DREAD Originally, each vul (DREAD) was graded 0-no threat to 10-high. It’s not simple. It’s subjective. Frequent disagreement over risk numbers customers don’t agree with developers people with the same roles don’t agree This lead to a simpler severity rating system...
A Graph of Threats High Medium Probability of Occurrence Modest Low Potential Damage Low Modest Medium High