Download
1 / 38
390 likes | 543 Views
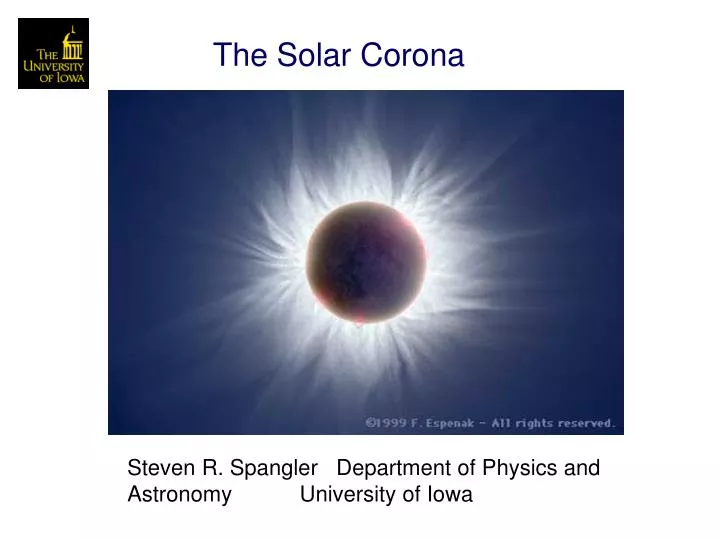
The Solar Corona. Steven R. Spangler Department of Physics and Astronomy University of Iowa. Basic facts on the Sun. Distance: 149.6 million km (1 astronomical unit) Radius: 696,000 km (6378 km for Earth) Mass: 1.989E30 kg (5.97E24 kg for Earth).

E N D
The Solar Corona Steven R. Spangler Department of Physics and Astronomy University of Iowa
Basic facts on the Sun • Distance: 149.6 million km (1 astronomical unit) • Radius: 696,000 km (6378 km for Earth) • Mass: 1.989E30 kg (5.97E24 kg for Earth)
Let’s begin by considering the disk of the Sun What we see as the disk of the Sun is a layer in its atmosphere called the photosphere
The Sun is a beautiful illustration of Blackbody Radiation, including Wien’s Law The solar spectrum is a good match (although not perfect) to a blackbody spectrum
A calculation on the extent of the solar atmosphere Pressure scale height Acceleration of gravity Solar photospheric data Result: l=175 km… the height of the solar atmosphere should be very small compared with the radius of the Sun
Yet, above the photosphere is the chromosphere, which extends upward 1000 km or more
The Solar Corona It can extend out into space several solar radii
This unexplained large “scale height” of the solar atmosphere was recognized by the beginning of the 20th century. Some scientists attributed it to the presence of a superlight element, “coronium” in the corona
The existence of “coronium” also seemed indicated by unknown lines in the spectrum of the corona • The 1905 book “The Sun” by Abbott commented on the unidentified green and red lines in eclipse spectra • Mystery resolved by Grotian around 1940 • Red and green lines are FeX and FeXIV, indicating temperatures of 1 - 2 million K
The main problem in solar physics, and one of the main problems in astrophysics, is explaining why the corona has a temperature of 1 - 2 million K
Most theories for coronal heating invoke a mechanism involving the solar magnetic field • How can a magnetic field heat a gas? • Spatial variations in magnetic field produce currents, currents produce Joule heating • Ionized gases with magnetic fields (plasmas) carry waves. Waves can be generated in one part of the solar atmosphere and be damped in another • For the right answer, we need measurements of the solar magnetic field
Above the corona: direct magnetometer measurements in the solar wind
How do we measure B in the corona itself? Direct measurements out here Zeeman measurements here
Physics of Faraday Rotation Demonstration
Signal Generators and Detectors: Observations of Extragalactic Radio Sources with Radio Interferometers
Very Large Array • Radio interferometer • 27 antennas • B or A array • Observations taken at 1465 and 1665 MHz
We use “constellations” of radio sources to do a sort of tomography of the corona
From The Astrophysical Journal 668(1):520-532. @ 2007 by The American Astronomical Society. For permission to reuse, contact journalpermissions@press.uchicago.edu. Ingleby, Spangler, Whiting 2007 Fig. 3.— Illustration of data used to obtain the coronal Faraday rotation for one of the lines of sight, that to 2325−049 on March 12. In all three panels, the orientation and length of the plotted lines correspond to the polarization position angle and the polarized intensity, respectively, at that position in the source. The contours are of total intensity (Stokes parameter I). (a) The 1465 MHz polarization position angle map on March 12, when the line of sight passed through the corona. (b) Similar map of the source on May 29, when the corona was far from the source. (c) Position angle difference between the two maps, Δχ, which is the Faraday rotation due to the corona. For both components of the source, the Faraday rotation is 14°, corresponding to an RM of 6 rad m−2. The resolution of all three maps is about 5 $\arcsec$ (angular diameter FWHM of the restoring beam).
From The Astrophysical Journal 668(1):520-532. @ 2007 by The American Astronomical Society. For permission to reuse, contact journalpermissions@press.uchicago.edu. Fig. 3.— Illustration of data used to obtain the coronal Faraday rotation for one of the lines of sight, that to 2325−049 on March 12. In all three panels, the orientation and length of the plotted lines correspond to the polarization position angle and the polarized intensity, respectively, at that position in the source. The contours are of total intensity (Stokes parameter I). (a) The 1465 MHz polarization position angle map on March 12, when the line of sight passed through the corona. (b) Similar map of the source on May 29, when the corona was far from the source. (c) Position angle difference between the two maps, Δχ, which is the Faraday rotation due to the corona. For both components of the source, the Faraday rotation is 14°, corresponding to an RM of 6 rad m−2. The resolution of all three maps is about 5 $\arcsec$ (angular diameter FWHM of the restoring beam).
From The Astrophysical Journal 668(1):520-532. @ 2007 by The American Astronomical Society. For permission to reuse, contact journalpermissions@press.uchicago.edu. Fig. 3.— Illustration of data used to obtain the coronal Faraday rotation for one of the lines of sight, that to 2325−049 on March 12. In all three panels, the orientation and length of the plotted lines correspond to the polarization position angle and the polarized intensity, respectively, at that position in the source. The contours are of total intensity (Stokes parameter I). (a) The 1465 MHz polarization position angle map on March 12, when the line of sight passed through the corona. (b) Similar map of the source on May 29, when the corona was far from the source. (c) Position angle difference between the two maps, Δχ, which is the Faraday rotation due to the corona. For both components of the source, the Faraday rotation is 14°, corresponding to an RM of 6 rad m−2. The resolution of all three maps is about 5 $\arcsec$ (angular diameter FWHM of the restoring beam).
Plasma Contributions to the Faraday Rotation Integral We need enough observations to sort out various contributions to coronal density and magnetic field
From The Astrophysical Journal 668(1):520-532. @ 2007 by The American Astronomical Society. For permission to reuse, contact journalpermissions@press.uchicago.edu. Fig. 4.— Representation of measured RMs on sky charts. The four separate panels show the location of the radio sources relative to the Sun on each of the 4 days of observation. The asterisk indicates the position of the Sun, and the dashed line is the ecliptic. The size of the plotted circle is a rough indicator of the absolute magnitude of the RM. Filled circles correspond to positive RMs, and open circles represent negative RMs.
What have we learned from these observations? • A good model for the coronal magnetic field B as a function of r • Information on the functional form of B • Coronal B field is stronger than extrapolations from photosphere • More magnetic energy to dissipate
Future Developments • EVLA (Expanded VLA): Enormous increase in sensitivity of the VLA. Commissioning of the EVLA now in progress.. • EVLA at 5 GHz: Will make measurements closer to the Sun, observations have more impact.
Modeling the coronal field from Faraday rotation measurements
Use of independent information on coronal density and location of the neutral line These measurements of magnetic field and density at ~ 3R can be used to estimate B and n at greater distances probed by Faraday Rotation
From The Astrophysical Journal 668(1):520-532. @ 2007 by The American Astronomical Society. For permission to reuse, contact journalpermissions@press.uchicago.edu. Fig. 7.— Comparison of model and observed RMs. The line through the origin is not a fit, but it indicates perfect agreement. The top panel shows all the data. The bottom panel shows the inner part of the diagram, containing most of the measurements, for which $\vert \mathrm{RM}\,\vert \leq 20$ rad m−2. The sets of triangles indicate measurements of the two RM‐variable sources, 2351−012 and 0046+062. In these cases, each plotted symbol indicates a measurement integrated over a time‐limited subset of the data. The model RMs have been calculated with a value of the adjustment parameter $\Gamma =25$ (see eq. [8] for a definition of Γ).
From The Astrophysical Journal 668(1):520-532. @ 2007 by The American Astronomical Society. For permission to reuse, contact journalpermissions@press.uchicago.edu. Fig. 7.— Comparison of model and observed RMs. The line through the origin is not a fit, but it indicates perfect agreement. The top panel shows all the data. The bottom panel shows the inner part of the diagram, containing most of the measurements, for which $\vert \mathrm{RM}\,\vert \leq 20$ rad m−2. The sets of triangles indicate measurements of the two RM‐variable sources, 2351−012 and 0046+062. In these cases, each plotted symbol indicates a measurement integrated over a time‐limited subset of the data. The model RMs have been calculated with a value of the adjustment parameter $\Gamma =25$ (see eq. [8] for a definition of Γ).
Time variation in the coronal Faraday rotation as Indications of coronal “transients”