Download
1 / 23
310 likes | 494 Views
Advance Water Management Smart Water. December 2009 Pnina Vortman IBM Haifa Research Lab. Organizations will manage their environmental impact by addressing three critical resources:. WATER. Water is needed to generate energy and energy is need to provide water.

E N D
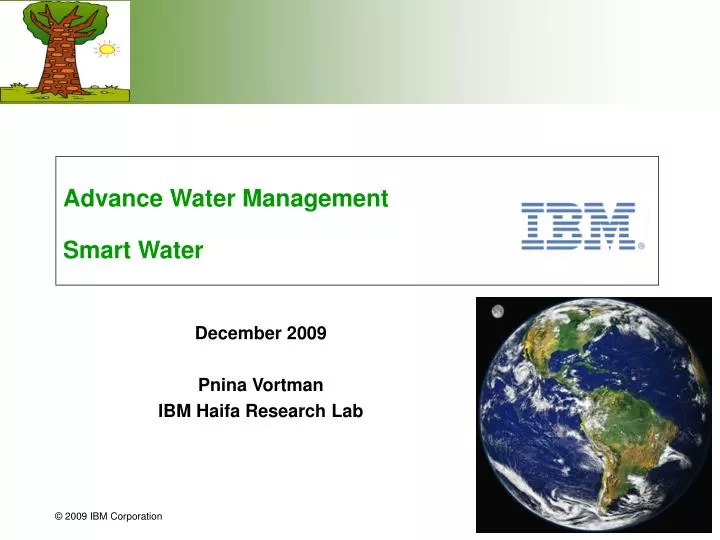
Advance Water ManagementSmart Water December 2009 Pnina Vortman IBM Haifa Research Lab
Organizations will manage their environmental impactby addressing three critical resources: WATER Water is needed to generate energy and energy is need to provide water. CO2 emissions contribute to climate change, which impacts water systems. CARBON ENERGY Energy production results in CO2 emissions.
Something profound is happening…. INSTRUMENTED We now have the ability to measure, sense and see the exact condition of practically everything. INTERCONNECTED People, systems and objects can communicate and interact with each other in entirely new ways. INTELLIGENT We can respond to changes quickly & accurately, getting better results by predicting and optimizing for future events.
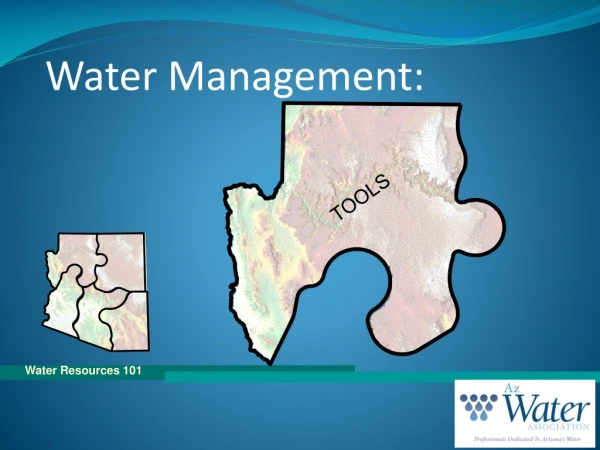
Water Management – what do we mean ? • When you say ‘water’ there are many issues involved: • Sources: traditional, alternative • Traditional: Lakes, Rivers, Aquifer, Wells • Alternative: Desalination, Recycled, Types • Impact on the environment • Must monitor to be able to measure and know • Must be able to control in real-time • Quality of water • Various quality based on usage : drinking, agriculture, industrial • Recycling • Water purification for reuse in agriculture and industrial • Water purification to protect the underground water and rivers • Water reuse for residential use • Wastewater • Protecting the environment • Monitor to prevent contamination
Integrated View of Intelligent Water Management Water Sources Rivers and lakes Historical Analytics Real-time Analytics Underground water Collection Optimized Leakage Reduction Optimized Electrical Power Optimal Water Blending Proactive Water Maintenance Desalination Asset Management with QoS Extension Purification plant Water sensors and meters QoS Specification Water Network Design
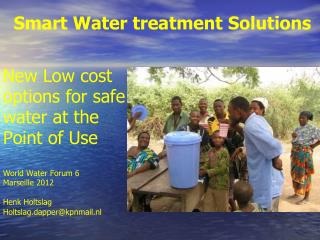
Alternative Sources of Water – Desalination Plants Must monitor to understand the impact of desalination on the environment. How do we get rid of the brine ?
Fighting Floods We need to be able to predict the weather within small areas. How can we help ? Require data collection.
Fighting Draughts We need to save water, find alternatives, control usage, predict the weather within small areas and conserve rain water. Optimization, simulation, and forecasting.
Provides automated sensing of physical environments Provides water quality, quantity, integration, storage, analysis, modeling, and a management dashboard on a local or regional basis Provides records management and reporting capabilities for regulatory and compliance requirements. Provides energy usage information to pinpoint energy efficiency opportunities related to water Provides advanced asset management and advanced meter management capabilities Provide intelligence to proactively manage risk related to extreme weather events Strategic Water Information Management Platform
Paraguay-Paraná River Basin, Brazil Managing & Monitoring Water Systems By measuring, monitoring and managing environmental systems, decision makers will have more knowledge of how their decisions will influence the environment & business.
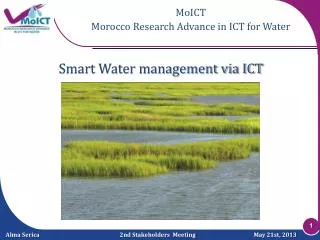
Smart Water Management system in residential areas Machine Learning based analysis Machine Learning based water management to detect anomalies, analyze trends, understand behavioral models, and provide usage predictions and inputs to optimization. Collect and analyze information from water metering in real-time Monitoring and integrate information from sewer and water systems in real-time
Water Analytics for generating Usage Patterns, Detect Anomalies, Predict and Forecast Water Demand • Goals • Understand usage patterns to detect anomalies and predict demand • Distribute energy consumption to minimize cost based on the usage patterns • Adapt water pressure based on usage patterns • Technology solution • Machine Learning and analytics which analyze water usage data from smart metering and smart valves/pumps generating reports and generating alerts when anomaly is detected • Results • Analytical reports, alerts, and dashboard based on smart metering data to understand usage patterns, applied clustering analysis and provided prediction • Using GIS, map usage patterns over the geographic map based on household • Scenarios • Water utility command center receives alert, monitors and observe an anomaly in usage. Message is sent to customer • Customer checks problem and fix it. High customer satisfaction.
Example: Before and after leakage fixing • Time-of-day analysis shows the leak drowned the actual demand
Water Leakage Reduction Through Dynamic Pressure Management – with company in Israel • Problem Overview: • Significant amounts of water are lost due to leakage in water networks • The leakage can be reduced by lowering the pressure of the supplied water • However, sufficient pressure must be maintained to provide the required time varying demand for water flow • Solution Approach: • Minimize leakage by dynamic control of valves so as to reduce pressure while providing required flow • Utilizes Combination of forecasting, hydraulic simulation and optimization models/techniques • Includes real time monitoring and control infrastructure to constantly adapt based on actual consumer water flow requirements • Benefit: Significant reduction in water leakage
Quality of Service in Water Systems • Need to agree on pressure and quality levels of water for residential, commercial, and industrial • Asset management systems manage and store information about every element in the water network systems such as pumps, valves, pools, meters • Asset management systems can be expanded to “remember” incidents and location of every asset in the water network • Can introduce maintenance optimization based on location and state • Can optimize power cost for pumping water • Leakage detection combined with GIS systemcan assist in minimize network closure • Integrated with usage analytics, can controlpressure and adapt dynamically • Integrated with quality sensors, can minimizethe contamination expansion
The Water for Tomorrow Project • Combine science-driven conservation with I/T expertise and computing power • Build a novel software modeling framework to simulate the behavior of river basins around the world • Inform policy and management decisions that conserve the natural environment and benefit the people who rely on these resources • Sample questions: • What impact will development have on water availability for wetlands and farming downstream? • Will clear-cutting a forest in the upper part of a river's watershed imperil fish stocks local people depend on for food? • Management tradeoffs including crop production, water balance, water quality, carbon storage, biodiversity and economic metrics. • Data: climate, rainfall, land cover, soil moisture, land use, etc. • Software: • Scenario forecasting tools • Integrative modeling framework • 3-D visualization
The Beacon Institute • Mission: “To create a global center for interdisciplinary research, policy-making and education regarding rivers, estuaries and their connection with society.” • The goal: turn all 315 miles of the Hudson river into a distributed network of sensors that will collect and analyze biological, physical, and chemical information • Create a river and estuary observatory through a collaborative program of technology innovation and development aimed at advancing science, management, and education • Link models to the river ecosystem to understand phenomena across a range of spatial and temporal scales
Smart Bay—Galway Bay, Ireland • Collaboration with the Marine Institute, Ireland • A research, test and demonstration infrastructure for monitoring and managing aquatic environmental data such as tidal flow, wave heights, temperature, and phytoplankton via an integrated network of sensors, robotics and computational technology distributed throughout the Bay.
IntelligentSensor Networks - Ijkdijk • Dutch “Smart Levee” Test Site • Collaboration with Ijkdijk Foundation, Deltares & TNO • 6 meters high (coastal levee category) • 100 meters long • 30 meters wide Active monitoring via sensor network to gain insight on levee internal stability
Advanced Water Management - Utility Scale 5) Weather, climate and hydrological models provide additional insight into water quality or availability impacts 1) Data collection may begin upstream from the treatment plant 4) Wireless network links meters and sensors to central console 2) Sensors are deployed on all water inlets and/or outlets to detect key contaminants. Discharge outlets are also metered. Data are also drawn from SCADA systems. (Manual inputs may also be used) 7) Advanced analytics provides additional predictive capability 3) Data are also drawn from external sources such as historical databases or remote sensing / geographical surveys 6) Web console acts as a control center for integrating all water data and enabling drill down on any parameter related to water availability, quality or associated energy costs. Alerts generated if necessary. Multiple locations can be rolled up.
IBM 200 mm and 300 mm wafer fabs – Water management Challenge • Reduce water consumption (and associated need for energy, chemicals, maintenance and labor) to reduce operating cost and minimize environmental impacts • Leverage end-to-end data acquisition, storage and visualization techniques to monitor water usage and improve efficiency Approach • Implemented data collection and storage infrastructure: sensors, IT network and servers • Statistical process control techniques used to continually analyze vast amounts of operational data and present information in efficient, concise interface • IBM’s Green Sigma™ methodology breaks down water usage by process: • Dashboards convey key process indicators • Identifies process improvements that reduce water consumption and provide other benefits, such as reduced electrical power consumption, heat recovery, cooling load reduction, process efficiency etc. Results • IBM has achieved over $3M in annual savings by reducing water usage by 27% and increasing manufacturing production over 30%