Download
1 / 21
220 likes | 318 Views
Technical Analysis of Commodity Markets: Emphasis on Bar Charts. Overview. Supply and demand ultimately determine commodity prices. There is an equilibrium or “market clearing” price at which quantity producers supply to the market equals the quantity buyers are willing to take.

E N D
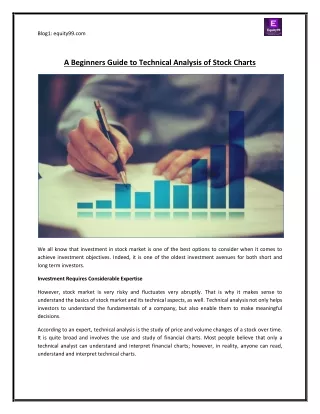
Technical Analysis of Commodity Markets: Emphasis on Bar Charts
Overview • Supply and demand ultimately determine commodity prices. • There is an equilibrium or “market clearing” price at which quantity producers supply to the market equals the quantity buyers are willing to take. • One of the functions of futures markets is to discover an “equilibrium price” for a future time period. However, supply and demand levels are not know with certainty months or even years into the future. • Futures prices vary across a wide range, as estimates of supply and demand are adjusted for changes in weather, economic conditions in Asia that will influence export buying, or changes in the U.S. dollar that influence the cost of U.S. commodities.
Figure 1. Equilibrium Supply and Demand Price S PE D Quantity
Overview cont. • Over time, a chart of prices for cotton futures or for live cattle will show patterns as the price discovery process responds to actual or perceived changes in supply and/or demand. • The study of those chart patterns is called technical analysis. • Such analysis is based on the notion that price and price patterns in the past are useful in forming expectations about what price will do in the future. • Technical analysis is especially useful in determining when to enter and exit the markets in programs designed to manage a firm’s exposure to price risk.
Overview cont. • Technical analysis can be complex. Sophisticated mathematical models can be used to help identify changes in the direction of price trend. • Econometric models are used by large hedgers and full-time speculators looking for a competitive edge. • But when used with discipline, some simple and basic techniques can make big contributions to price risk management programs. • The trend line can be used to spot a change in price direction. Connecting two daily price lows in a rising market or highs in a declining market, preferably at least 10 trading days apart, can help establish the trends.
Overview cont. • As seen in Figure 2, a few days after the daily low at B, the two daily lows at A and B can be connected, and an uptrend line can be drawn and extended up and to the right. This upward trend in price is expected to continue until the market closes below the extended trend line as seen in the area enclosed in the box. The manager with no price protection might consider hedging by selling futures or buying a put option when prices close below the uptrend line. • The sell signal generated by the close below the trend line will be seen worldwide by every trader and potential trader who is monitoring the chart. Perceptions of the fundamental demand/supply balance did not support still higher prices, and price direction turned negative. Short hedges placed above $109 protected the cattle feeder from prices that then plunged to the $87 level.
Overview cont. • The trend line approach is effective in markets that show sustained trends. Experienced producers often become selective hedgers and look for a later downtrend line drawn across two daily highs. A close above the downtrend line is a buying signal, an indication to the selective hedger to buy back or get out of the hedge. It is easy to visualize a downtrend line across the August and September highs on the chart. This approach to managing exposure to price risk can be effective in the livestock markets where price cycles still appear, and in grains, oilseeds, or cotton when buffer stocks are not large and weather developments prompt sustained price moves.
Overview cont. • Resistance and Support Planes also can be important guides to producers’ pricing actions. The Cotton chart in Figure 3 shows a rally reaching above $1.66 per pound in February. • The February price highs will provide major resistance if the price can climb back to those levels. Sell orders placed just below that resistance plane could be an excellent forward pricing strategy for the producer who wants to lock in a price. Notice that later, in early April, the prices climb to within 0.5 cents per pound of the February high. There will often be a huge set of sell orders – by hedgers and speculators – placed near that resistance plane. The selling pressure turns the market lower again. Like the trend line approach, this is something of a self-fulfilling prophecy and reflects the fact that the market has a hard time going to prices above prior failures. The high above $1.66 will create major resistance. Some significant change in the underlying supply/demand balance will be required for the market to move up through this resistance. Note that being prepared to forward price on rallies to the resistance at contract highs will typically capture higher prices than will the trend line approach.
Overview cont. • In a market that is working lower because of negative or bearish supply/demand fundamentals, there will be important intermediate level resistance planes. Typically, markets that move down from some high will move too far and then correct the over-reaction. Analysts watch for 38, 50, and 62 percent corrections. The correction leaves a daily high, and when the market later tries to rally, there will be resistance along the plane across that high. The corn futures contract in Figure 4 shows this pattern.
Overview cont. • The selling pressure will be less intense than at contract highs, but there will be hedgers and speculators looking for opportunities to sell the market. It is wise to place the sell order below the plane to increase the probability that the sell order will be reached and filled. Note that the March-June price advance was turned back by selling pressure at the resistance plane. • It is clear at this point and throughout the discussion that a will informed position on the fundamental supply/demand balance is very important. An informed position will help one decide whether a challenge of the resistance plane across the most recent high is possible or likely, or whether it is more likely that the market will be able to correct only part of the price decline.
Overview cont. • The feeder cattle futures contract in Figure 5 can be used to show the tendency of a bearish market to record corrections. Note the series of “C” labels. • The market is trending lower, and corrects or retraces part of that move. After a brief correction, the market moves down again. Sell orders placed just under the prior high would not have been filled in any of the three rallies during April and May. In a decidedly bearish market like this one, monitoring for signs of selling pressure on a 38, 50, or 62 percent correction and being ready to sell on that corrective rally will be important.
Overview cont. • The appearance of chart gaps can be useful, as seen in Figure 6. In mid-July, the Live Cattle futures contract recorded a gap. A price gap occurs when the high for the day is below the previous day’s low, or the low for the day is above the previous day’s high. The market’s reaction to gaps is somewhat like nature’s reaction to a vacuum – it tries to “fill” them. Often times the gaps will be filled, but not always. Note the mid-July gap above $110 was not filled by the late-July price rally, but the rally attempt ran out of gas at the bottom of the gap. Sell orders placed near the bottom of the gap have a better chance of being filled before the market continues down.
Overview cont. • Experienced hedgers and speculators will place sell orders just below the bottom of the gap to increase the probability the order will be filled. A gap will typically stop a correction or an attempt to challenge the resistance across the prior high. In this example, the rally into the gap area gave the producer one last chance to get short hedged before the downward price trend continued. • The relative strength index shows when the market is “overbought” and “oversold” and helps determine when the market has “corrected” as much as is likely. Threshold levels of 70 and 30 are used. Note in Figure 7 the surge to above 70 by the widely used 14-day RSI during early June when the December corn futures rallied to the prior resistance plane.
Overview cont. • The “overbought” condition helps assure decision makers that prices will turn back down. The RSI will also help avoid panicky selling on the lows. The July-September bottoming action/lows came in an oversold market with a divergence building between the RSI and the price chart, suggesting a possible rally is imminent. Waiting for a better price is in order, but being patient is hard when the financial integrity of the business is being threatened. The RSI can help bring resolve and discipline to these scenarios.
Overview cont. • Producers using agricultural commodities as inputs can simply turn this reasoning around. Long hedges are placed on closes above downtrend lines, on dips to important support planes, or on dips to the top of a gap left in an upward trending market. Whether the need is for price or cost protection, being able to read the charts is a significant advantage and gives the producer a level playing field. Processors, exporters and large speculators use technical analysis to help guide pricing actions. The producer can too.


![[PDF READ ONLINE] Reading Price Charts Bar by Bar: The Technical Analysis of Price Action for](https://cdn7.slideserve.com/12570796/slide1-dt.jpg)