Download
1 / 21
210 likes | 312 Views
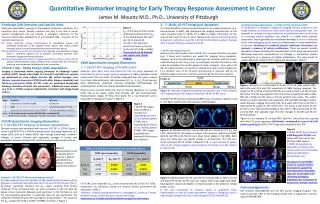
Computational Modeling in Quantitative Cancer Imaging. Tom Yankeelov, Nkiruka Atuegwu, John C. Gore Institute of Imaging Science, Departments of Radiology, Physics, Biomedical Engineering, and Cancer Biology Vanderbilt University. Biomedical Science and Engineering Conference 18 March 2009.

E N D
Computational Modeling in Quantitative Cancer Imaging Tom Yankeelov, Nkiruka Atuegwu, John C. Gore Institute of Imaging Science, Departments of Radiology, Physics, Biomedical Engineering, and Cancer Biology Vanderbilt University Biomedical Science and Engineering Conference 18 March 2009
Outline 1) Mathematical modeling of tumors 2) Basic Idea: Use Imaging to Drive Math Models 3) What can imaging provide? 4) An example /21
Outline 1) Mathematical modeling of tumors 2) Basic Idea: Use Imaging to Drive Math Models 3) What can imaging provide? 4) An example /21
Math Modeling of Tumors, 1/4 • Over last 10-15 years, many math models of tumor growth have appeared • Much experimental data on the growth kinetics of avascular tumors have been integrated into growth models • Deterministic reaction-diffusion equations used to model spatial spread of tumors • Continuum/solid mechanics, mechano-chemical modeling, including physical pressure and forces between cells and matrix Let’s look at an example… /21 Quaranta et al. Clinica Chimica Acta 2005;357:173-9.
Math Modeling of Tumors, 2/4 • Simulation of spatial distribution of tumor cells and tumor invasion • What do the equations look like that generate these kind of results? /21 Quaranta et al. Clinica Chimica Acta 2005;357:173-9.
Math Modeling of Tumors, 3/4 Avascular Model Example MDE = matrix degrading enzyme MM = matrix molecule • These are “conservation of matter” equations… and they work quite well; but… /21 Anderson et al. Cell 2006;127:905-15.
Math Modeling of Tumors, 4/4 … their application to in vivo physiological events has been extremely limited • Current models of tumor growth rely on knowledge of data that is quite difficult to measure in an intact living system: • metrics of chemotaxis, haptotaxis, growth factor gradients, MDEs, etc. • Thus, general limitation of these models is that they are driven by parameters that can be measured only by highly invasive methods or in idealized systems • In addition to difficulty of measuring these parameters in animal systems, it is extremely difficult to measure in clinical setting /21
Outline 1) Mathematical modeling of tumors 2) Basic Idea: Use Imaging to Drive Math Models 3) What can imaging provide? 4) An example /21
Basic Idea: Use Imaging to Drive Math Models • We propose to construct math models of tumor growth that can be parameterized by data obtained from noninvasive imaging experiments Existing models driven by parameters obtained invasively; not 3D; clinically? • Approach is fundamentally different as models would be driven by parameters obtained noninvasively and in 3D • Can be measured repeatedly to update and refine predictions • Thus, models driven by imaging data will make predictions based on individual tumor characteristics that can be tested during longitudinal studies Allows for in vivo hypothesis testing /21
Outline 1) Mathematical modeling of tumors 2) Basic Idea: Use Imaging to Drive Math Models 3) What can imaging provide? 4) An example /21
Distance from original position Free Restricted ~√t What can imaging provide, 1/2? • Fundamental characteristic of cancer is unchecked cell proliferation • can be quantified by “diffusion weighted MRI” (DW-MRI) • Water molecules wander about randomly in tissue (Brownian Motion) • In free solution, after time t, molecules travel (on average) a distance L • But in cellular tissue, compartment effects hinder movement = restricted diffusion • Thus, the Apparent Diffusion • Coefficient (ADC) is lowered /21
What can imaging provide, 2/2? Diffusion weighted MRI • ADC depends on cell volume fraction 17 days 24 days 31 days ADC (MRI) tumor ADC • Increasing cell density (cellularity); more cell membranes per cm to hinder diffusion lower ADC • Tumor cellularity may be monitored by DW-MRI /21 Anderson et al. Magn Reson Imaging. 2000;18:689-95 Hall et al. Clin Canc Res 2004;10:7852
Outline 1) Mathematical modeling of tumors 2) Basic Idea: Use Imaging to Drive Math Models 3) What can imaging provide? 4) An example /21
An example, 1/5 • The logistic growth model incorporates exponential growth of tumor cells early; asymptotically approaches cellular carrying capacity N0 = number of cells initially present k = cells proliferative rate q = carrying capacity of the population • Solution given by: Goal is to apply this in the imaging setting /21 Byrne. "Modelling Avascular Tumor Growth," in Cancer Modeling and Simulation
An example, 2/5 First application: obtain maps of the proliferation rate, k • Assign the parameters from available imaging data • Carrying capacity: • q = (voxel volume)/(cell volume) • Need to measure cell number, N(t), or at least relative cell number, Nrel(t) • ADC is related to cell number: • ADC(t) = ADCw – lN(t), • ADCw = ADC of free water • N(t) = cell number • l = proportionality constant ADC /21 Anderson et al. Magn Reson Imaging. 2000;18:689-95.
An example, 3/5 First application: obtain maps of the proliferation rate, k • Then we can write the relative number of cells at time t : • Nrel(t) = N(t)/N0 • = [ADC(t) – ADCw]/[ADC(0) – ADCw] • Thus, we have converted from measured ADC at time t to a relative cell number at time t given by Nrel(t) • Rewrite the solution to logistic equation as: Every term in above relation is known, except proliferation rate, k /21
An example, 4/5 First application: obtain maps of the proliferation rate, k • Consider, a rat brain tumor model where multiple imaging sessions are planned in both treated and control animals • Tumors are allowed to grow and ADC(t) is measured to estimate Nrel(t) • Since q is fixed, and Nrel(t) and Nrel(0) are measured, can fit data to extract k for each voxel thereby yielding a proliferation rate map • Testable hypothesis: rats from treated and untreated groups would display different k distributions • could be used to separate responders from non-responders /21
An example, 5/5 • Can also use this approach to simulate growth by combining with other methods • Taking data from ADC (MRI), proliferation (FLT-PET), hypoxia (FMISO-PET) Nkiruka Atuegwu, Ph.D. /21
Summary • We have presented an approach whereby imaging data can drive a (simple) mathematical model of tumor growth • The example provided here is quite simple, represents only a first step • Approach is fundamentally different as our models are driven by parameters obtained noninvasively in 3D • Can be measured repeatedly to update and refine predictions • Models driven by imaging data will make predictions based on individual tumor characteristics that can be tested during longitudinal studies Allows for in vivo hypothesis testing /21
Acknowledgements • VUIIS Director • John C. Gore, Ph.D. • Collaborators • Jim Nutaro, Ph.D. Nkiruka Atuegwu, Ph.D. • Mike Miga, Ph.D. Shelby Wyatt, Ph.D. • Tuhin Sinha, Ph.D. • Funding NIBIB 1K25 EB005936 (Career Development Award) NCI 1R01CA129961 NIBIB R01 EB000214 /21
Thank you very much for your time and attention. Vanderbilt University Institute of Imaging Science /21