Download
1 / 1
10 likes | 117 Views
Economically Optimal Plant Population Density in Midsouth Soybean Production Nathanael M. Thompson 1* , James A. Larson 1 , Roland K. Roberts 1 , Alemu Mengitsu 2 , and Eric Walker 3 1 Agricultural and Resource Economics, The University of Tennessee, Knoxville, TN

E N D
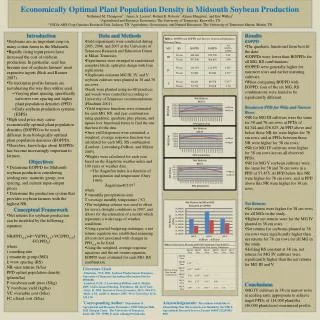
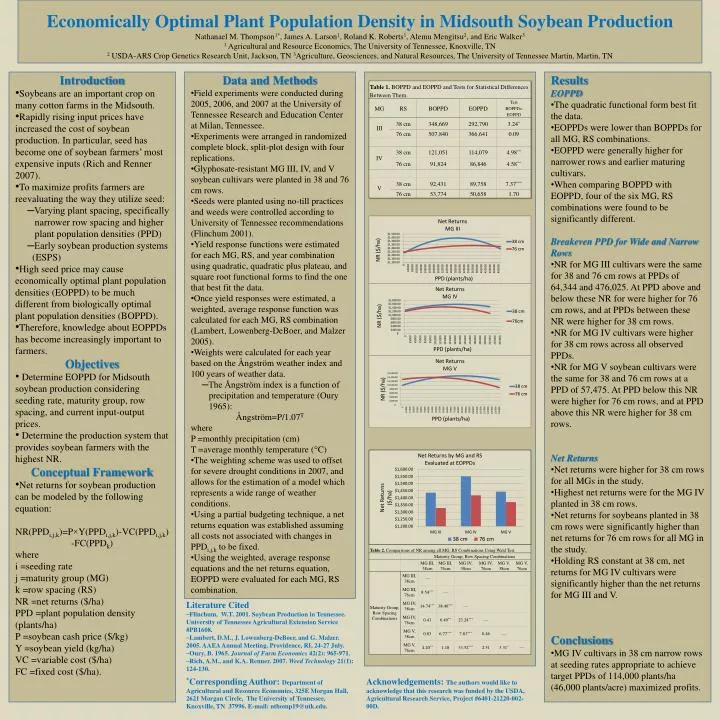
Economically Optimal Plant Population Density in Midsouth Soybean Production Nathanael M. Thompson1*, James A. Larson1, Roland K. Roberts1, Alemu Mengitsu2, and Eric Walker3 1 Agricultural and Resource Economics, The University of Tennessee, Knoxville, TN 2 USDA-ARS Crop Genetics Research Unit, Jackson, TN 3Agriculture, Geosciences, and Natural Resources, The University of Tennessee Martin, Martin, TN • Introduction • Soybeans are an important crop on many cotton farms in the Midsouth. • Rapidly rising input prices have increased the cost of soybean production. In particular, seed has become one of soybean farmers’ most expensive inputs (Rich and Renner 2007). • To maximize profits farmers are reevaluating the way they utilize seed: • ─Varying plant spacing, specifically • narrower row spacing and higher • plant population densities (PPD) • ─Early soybean production systems • (ESPS) • High seed price may cause economically optimal plant population densities (EOPPD) to be much different from biologically optimal plant population densities (BOPPD). • Therefore, knowledge about EOPPDs has become increasingly important to farmers. • Objectives • Determine EOPPD for Midsouth soybean production considering seeding rate, maturity group, row spacing, and current input-output prices. • Determine the production system that provides soybean farmers with the highest NR. • Conceptual Framework • Net returns for soybean production can be modeled by the following equation: • NR(PPDi,j,k)=P×Y(PPDi,j,k)-VC(PPDi,j,k) • -FC(PPDk) • where • i =seeding rate • j =maturity group (MG) • k =row spacing (RS) • NR =net returns ($/ha) • PPD =plant population density (plants/ha) • P =soybean cash price ($/kg) • Y =soybean yield (kg/ha) • VC =variable cost ($/ha) • FC =fixed cost ($/ha). • Data and Methods • Field experiments were conducted during 2005, 2006, and 2007 at the University of Tennessee Research and Education Center at Milan, Tennessee. • Experiments were arranged in randomized complete block, split-plot design with four replications. • Glyphosate-resistant MG III, IV, and V soybean cultivars were planted in 38 and 76 cm rows. • Seeds were planted using no-till practices and weeds were controlled according to University of Tennessee recommendations (Flinchum 2001). • Yield response functions were estimated for each MG, RS, and year combination using quadratic, quadratic plus plateau, and square root functional forms to find the one that best fit the data. • Once yield responses were estimated, a weighted, average response function was calculated for each MG, RS combination (Lambert, Lowenberg-DeBoer, and Malzer 2005). • Weights were calculated for each year based on the Ångström weather index and 100 years of weather data. • ─The Ångström index is a function of • precipitation and temperature (Oury • 1965): • Ångström=P/1.07T • where • P =monthly precipitation (cm) • T =average monthly temperature (°C) • The weighting scheme was used to offset for severe drought conditions in 2007, and allows for the estimation of a model which represents a wide range of weather conditions. • Using a partial budgeting technique, a net returns equation was established assuming all costs not associated with changes in PPDi,j,k to be fixed. • Using the weighted, average response equations and the net returns equation, EOPPD were evaluated for each MG, RS combination. • Results • EOPPD • The quadratic functional form best fit the data. • EOPPDs were lower than BOPPDs for all MG, RS combinations. • EOPPD were generally higher for narrower rows and earlier maturing cultivars. • When comparing BOPPD with EOPPD, four of the six MG, RS combinations were found to be significantly different. • Breakeven PPD for Wide and Narrow Rows • NR for MG III cultivars were the same for 38 and 76 cm rows at PPDs of 64,344 and 476,025. At PPD above and below these NR for were higher for 76 cm rows, and at PPDs between these NR were higher for 38 cm rows. • NR for MG IV cultivars were higher for 38 cm rows across all observed PPDs. • NR for MG V soybean cultivars were the same for 38 and 76 cm rows at a PPD of 57,475. At PPD below this NR were higher for 76 cm rows, and at PPD above this NR were higher for 38 cm rows. • Net Returns • Net returns were higher for 38 cm rows for all MGs in the study. • Highest net returns were for the MG IV planted in 38 cm rows. • Net returns for soybeans planted in 38 cm rows were significantly higher than net returns for 76 cm rows for all MG in the study. • Holding RS constant at 38 cm, net returns for MG IV cultivars were significantly higher than the net returns for MG III and V. • Conclusions • MG IV cultivars in 38 cm narrow rows at seeding rates appropriate to achieve target PPDs of 114,000 plants/ha (46,000 plants/acre) maximized profits. • Literature Cited • Flinchum, W.T. 2001. Soybean Production in Tennessee. University of Tennessee Agricultural Extension Service #PB1608. • Lambert, D.M., J. Lowenberg-DeBoer, and G. Malzer. 2005. AAEA Annual Meeting, Providence, RI, 24-27 July. • Oury, B. 1965. Journal of Farm Economics 42(2): 965-971. • Rich, A.M., and K.A. Renner. 2007. Weed Technology 21(1): 124-130. *Corresponding Author: Department of Agricultural and Resource Economics, 325E Morgan Hall, 2621 Morgan Circle, The University of Tennessee, Knoxville, TN 37996. E-mail: nthomp19@utk.edu. Acknowledgements: The authors would like to acknowledge that this research was funded by the USDA, Agricultural Research Service, Project #6401-21220-002-00D.