Download
1 / 27
270 likes | 414 Views
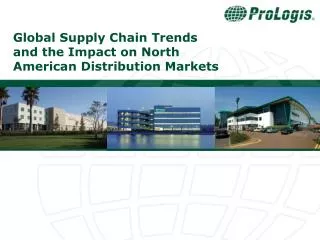
Global Supply Chain Trends and the Impact on North American Distribution Markets. Our Global Platform. Asia 10.5 msf 2 countries 6 markets. North America 347.7 msf 3 countries 51 markets. Europe 128.1 msf 13 countries 53 markets. ProLogis associates around the globe serve

E N D
Global Supply Chain Trends and the Impact on North American Distribution Markets
Our Global Platform Asia • 10.5 msf • 2 countries • 6 markets North America • 347.7 msf • 3 countries • 51 markets Europe • 128.1 msf • 13 countries • 53 markets ProLogis associates around the globe serve more than 4,000 customers in 18 countries 2
Driving Demand – Global Trade Growth World Trade World GDP Growth in World Trade and World GDP, 1988-2007 Sources: Haver Analytics, ProLogis
U.S. Imports From China China Admitted to WTO $US in billions Source: U.S. Census Bureau
Driving Demand – Seaports vs. Airports Total Cargo Volume - 2006 2.9 billion metric tons .072 billion metric tons* Airports Seaports Seaports handle more than 97% of world cargo by volume Sources: UN Review of Maritime Transport 2006, ACI Traffic Data for 2006, ProLogis analysis *Estimate based on reported cargo volume for Top 30 global airports
TEU Growth at Top 15 Container Ports 1996 Number of TEUs 10,000,000+ 5,000,000+ Total TEU68,300,000 2,000,000+
TEU Growth at Top 15 Container Ports 2007 Number of TEUs 20,000,000+ 15,000,000+ 10,000,000+ Total TEU68,300,000 Total TEU211,000,000 5,000,000+
Transit Times 6 Prince Rupert 7 Vancouver Tacoma/Seattle 5 Toronto 13 Chicago 12 NewYork 5 5 Oakland 13 26 8 Norfolk LA/ Long Beach Atlanta Dallas 25 Charleston 8 5 6 25 Savannah 13 Houston 28 Shanghai 13 19 LazaroCardenas
North America Port Activity Source: Containerization International, port websites
North America Container Market Share Source: Containerization International *Some 2007 data estimated
Share N.E. Asia – U.S. East Coast Route Source: Panama Canal Authority
Panama Canal - Update • 48-mile canal built in early 1900s • 14,000 ships/year • Maximum capacity-container ships ~ 5,000 TEUs • Largest container ships being built today carry 10,000+ TEUs • US$5 billion expansion approved by Panamanian voters in 2006 • Adds new, wider locks • Expected to double capacity when completed in 2014 • Secondary ports on Gulf Coast and East Coast anticipate surge in traffic following project completion Photo: Sealand Meteor at the Panama Canal (3,800 TEUs)
Panama Canal Current Canal lock dimensions: 1000’ x 110’ x 41’Future Canal lock dimensions: 1400’ x 180’ x 60’
Logistics Cost Breakdown 8.8% 1.9% 0.2% 0.7% 1.5% 4.4% *Rent/building cost is 25% of this number. Source: Herbert W. Davis and Company, 2006 database 21
Regional Distribution: Percentage of U.S. Population Within 500 Miles
Population Based Network Model « « « « « « « « « « « « « « « « « « « « « « « « « « « « « « « « « « « « « « « « « « « « « « « « « « « « « « « « « « « « « « « « « « « « « « « « « The 10 Best Warehouse Networks Networks with the Lowest Possible “Time-to-Market” « Source: Chicago Consulting
Metrics Driving Industrial Real Estate Demand • Key metrics in evaluating top markets for future distribution centers: • Proximity to large local population base • Physical port capacity for growth in TEUs handled • Good road infrastructure from the port • Inland ports – intermodal rail connections • For export markets, proximity to diverse manufacturing centers • Availability and cost of labor, degree of union activity, and risk of labor strikes • Frequency and availability of dedicated liner service
Future trends as we see it • Warehousing moving closer to inland ports/Intermodal Terminals • Drayage costs • Railroad Service • Increasing flexibility in supply chains • Diversified Port Strategies- Increase activity for East Coast ports • Continually changing sources of supply • Distribution Network Adjustments • New network rationalization • Deconsolidation centers as additions to network
Gregory J. Arnold One Capital Drive, Suite 103 Cranbury, NJ 08512 Phone: 609.409.2120 Email: garnold@prologis.com