Download

1 / 19
190 likes | 308 Views
Energy Management & Alternative Energy Use in the Water Sector. John S. Young, Jr., P.E. President – American Water Works Service Co. November 19, 2008. Every day we operate and manage: 45,000 miles of distribution and collection mains And more than: 80 surface water treatment plants

E N D
Energy Management & AlternativeEnergy Use in the Water Sector John S. Young, Jr., P.E. President – American Water Works Service Co. November 19, 2008
Every day we operate and manage: 45,000 miles of distribution and collection mains And more than: 80 surface water treatment plants 600 groundwater treatment plants 1,000 groundwater wells 40 wastewater treatment plants Utility Only O&M Only Both We manage more than 350 individual water systems in 32 states serving approximately 15M people in 1,600 communities 2
How Much Electricity Does the Water Industry Use? • Drinking water and wastewater consume: • 3% of domestic electricity1 • 7% of worldwide electricity • 19% of California electricity2 • Water utility energy use varies widely from 0.25 to 3.5 kWh per 1,000 gallons of drinking water produced and delivered3 • The median 50% of water utilities serving populations >10,000 have electricity use between 1.0 and 2.5 kWh/1,000 gallons3 • Electric Power Research Institute (Burton 1996) • Energy Down the Drain: The Hidden Costs of California’s Water Supply • AwwaRF 91201.Energy Index Development for Benchmarking Water and Wastewater Utilities
Why does it take so much electricity to pump water?Water is Heavy! Over 4 tons per 1,000 gallons!
Emerging Technologies Use More Energy • New regulations are increasing the use of the following, energy intensive treatment processes: • Added TechnologyAdditional Energy • UV Disinfection 70-100 kWh/MG • Ozone 170 kWh/MG • Membranes • Nano and RO 1,800 kWh/MG • Ultrafiltration 1,000 kwh/MG • Microfiltration 100 kwh/MG
Water Resource & Water Quality Solution Cycle Innovative Solutions are needed to break this cycle!
Climate Leaders • A voluntary EPA partnership with U.S. companies to develop long-term, comprehensive climate change strategies • Inventory corporate GHG emissions • Set corporate-wide GHG reduction goals • Measure and report GHG emissions to the EPA • For more information and a list of Climate Leaders partners, please visit www.epa.gov/climateleaders
Project Status • January 2006: American Water signs Climate Leaders Partnership Agreement • March 2006: Submit draft GHG inventory to EPA • March 2006: AW Climate Leaders Kick-off Workshop • March 2007: Submit database tracking plan to EPA • December 2008: Complete 12 months of GHG emission monitoring and report same to EPA….baseline • September 2009: Submit GHG emissions reduction plan to EPA
Creating a GHG Inventory Conduct inventory using internationally recognized protocol (United Nations IPCC-Intergovernmental Panel on Climate Change) which includes: • Stationary Combustion: Fuels burned on-site for Furnaces, On-Site Generators, Hot Water Heaters, Engine Driven Devices (e.g. pumps), etc. • Mobile Combustion: Cars, Trucks, Boats & Planes • Fugitive Emissions: Refrigeration and Air Conditioning Units, Process emissions, Landfill emissions • Indirect Sources: From the fuels used to produce Purchased Electricity or Steam
AW Inventory of GHG Emissions Emissions in metric tons CO2e includes CO2, N2O and methane emissions Emissions from flared methane gas and HVAC were both <0.5%
Strategies to Reduce Energy and GHGe Intensity • Establishment of an Energy Management Group • Decreasing Non-Revenue Water (NRW) decreases water pumped = lower electrical use • Increase Pumping Efficiency • Conduct pump tests and optimize efficiency by trimming or replacing impellers • Install VFDs to maximize pump efficiency at each pump demand • Install new high efficiency pumps and motors • Upgrade lighting to latest generation florescent lighting • Optimize HVAC systems to provide only that level of cooling or dehumidification that is needed
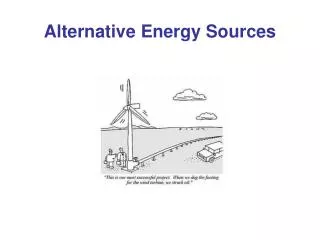
What About “Green Power?” • Solar • Wind • Bio-methane from plant and landfill recovery Purchasing or producing “Green Power” will decrease a utility’s greenhouse gas emissions, but it will not lower the power consumed.
Canal Road Solar Array 590 kW ground-mounted photovoltaic system Produces 687,000 kilowatts of energy / year Eliminates 721,245 pounds (327 metric tons) of CO2e per year
Benefits of On-Site Solar Generation • Fixed effective power cost for system life (25 years or more) • Last 30 years, electricity has increased 4.6% annually • Hedge against electricity/fossil fuel price volatility • Mitigate exposure to price spikes with Time Of Day rates • Reasonable return on investment • Availability of significant NJ rebates, federal tax incentives and tradable Renewable Energy Credits (SREC) yield a return on investment • Environmental Stewardship – Greenhouse Gas Reduction • Community goodwill • Positive publicity
Project Timeline • June 2004 - NJ Clean Energy Program rebates secured • December 2004 – Supply Contract Awarded to Dome-Tech Solar • January 2005 - Site Plan Submitted to local officials • February 2005 – Solicit Installation Bids & Award Installation • April 2005 Obtain Planning Board Approval • May 2005 – Installation Begins • September 2005 – System Startup
Economic Benefit • Total cost of project: $3.5 million • Net cost of project: $1.6 million (after receipt of rebates from NJ Clean Energy Program) • Generate over 585,000 kwh/year. • Annual savings: • $61k/yr in avoided electricity purchase • $99k/year for 5 years in sale of Renewable Energy Credits • $803k in tax benefits over six years • Approximately 5 year payback
Other Environmental Equivalents One year reduction from a 585,000 kWh solar plant. • 699,856 pounds of carbon dioxide This is equivalent to: • Planting 94 acres of tree seedlings • 2.6 Acres of forest preserved from deforestation • 36,163 gallons of gasoline • 13,230 propane cylinders used for home barbeques Sources: US EPA and U.S.- Climate Technology Cooperation
Conclusions • Addressing climate change makes good business sense • Water utilities are not just the recipients of the effects of climate change, they are also part of the problem! • Multiple mechanisms exist for water systems to control impact climate change • Reduce electrical use • Remember: 80-90% of water treatment plant electric consumption goes to pumping • Look beyond just reducing electrical use – be creative! • Climate Leaders and other programs like it provide a structured mechanism for documenting and minimizing GHG emissions