Download
1 / 35
350 likes | 457 Views
Using Reactor Neutrinos to Study Neutrino Oscillations Jonathan Link Columbia University Heavy Quarks and Leptons 2004 June 1, 2004. Doing Physics With Reactors Neutrinos

E N D
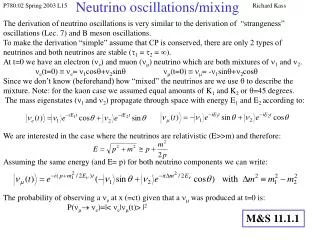
Using Reactor Neutrinos to Study Neutrino Oscillations Jonathan Link Columbia University Heavy Quarks and Leptons 2004 June 1, 2004
Doing Physics With Reactors Neutrinos The original Neutrino discovery experiment, by Reines and Cowan, used reactor neutrinos… e+ νe W n p Reines and Cowan at the Savannah River Reactor The first successful neutrino detector …actually anti-neutrinos. The νe interacts with a free proton via inverse β-decay: Later the neutron captures giving a coincidence signal. Reines and Cowan used cadmium to capture the neutrons.
Nuclear Reactors as a Neutrino Source • Nuclear reactors are a very intense sources of νe deriving from the b-decay of the neutron-rich fission fragments. • A typical commercial reactor, with 3 GW thermal power, produces 6×10²⁰ne/s From Bemporad, Gratta and Vogel Arbitrary Observable n Spectrum • The observable ne spectrum is the product of thefluxand thecross section. • The spectrum peaks around ~3.6 MeV. • Visible “positron” energy implies ν energy Cross Section Flux Eν = Ee + 0.8 MeV ( =mn-mp+me-1.022) • Minimum energy for the primary signal is 1.022 MeV from e+e−annihilation at process threshold. • Two part coincidence signal is crucial for background reduction.
Uses of Reactor Neutrinos • Measure cross sections or observe new processes (e.g. neutral current nuclear coherent scattering) • Search for anomalous neutrino electric dipole moment • Measure the weak mixing angle, sin2θW • Monitor reactor core (non-proliferation application) • Measure neutrino oscillation parameters (Δm2’s and mixing angles)
Observations of Neutrino Oscillations Reactor neutrinos can probe oscillations in all three observed Δm2 regions. Oscillations are observed as a deficit of νe with respect to expectation. Short Baseline: 10 to 100 meters Bugey, Gosgen & Krasnoyarsk Medium Baseline: 1 to 2 km Chooz, Palo Verde & future Long Baseline: 100+ km KamLAND Δm2≈3 to 3×10⁻² eV2 θ?? Δm2≈2.5×10⁻³ eV2 θ23 & θ13 Δm2≈7.5×10⁻⁵ eV2 θ12
Short Baseline Oscillation Searches Experiments like Bugey rule out the low Δm2, large mixing angle region of the LSND signal. The Bugey Detector Neutrons capture on Lithium Reactor Excluded Bugey looked for evidence of oscillations between 15 & 45 meters. Gosgen was closer and Krasnoyarsk farther away.
Observations of Neutrino Oscillations Reactor neutrinos can probe oscillations in all three observed Δm2 regions. Oscillations are observed as a deficit of νe with respect to expectation. Short Baseline: 10 to 100 meters Bugey, Gosgen & Krasnoyarsk Medium Baseline: 1 to 2 km Chooz, Palo Verde & future Long Baseline: 100+ km KamLAND Δm2≈3 to 3×10⁻² eV2 θ?? Δm2≈2.5×10⁻³ eV2 θ23 & θ13 Δm2≈7.5×10⁻⁵ eV2 θ12
Medium Baseline Oscillation Searches Experiments like Chooz looked for oscillations in the atmospheric Δm2. At the time they ran the atmospheric parameters were determined by Kamiokande, not Super-K (larger Δm2). 1050 m baseline Chooz Nuclear Reactors, France Gadolinium loaded liquid scintillating target.
Medium Baseline Oscillation Searches < ~ • No evidence found for ne oscillation. • This null result eliminated nm→ne as the primary mechanism for the Super-K atmospheric deficit. • sin22q13< 0.18 at 90% CL (at Dm2=2.0×10⁻³) • Future experiments should try to improve on these limits by at least an order of magnitude. • Down to sin22q13 0.01 • In other words, a measurement to better than 1% is needed!
Observations of Neutrino Oscillations Reactor neutrinos can probe oscillations in all three observed Δm2 regions. Oscillations are observed as a deficit of νe with respect to expectation. Short Baseline: 10 to 100 meters Bugey, Gosgen & Krasnoyarsk Medium Baseline: 1 to 2 km Chooz, Palo Verde & future Long Baseline: 100+ km KamLAND Δm2≈3 to 3×10⁻² eV2 θ?? Δm2≈2.5×10⁻³ eV2 θ23 & θ13 Δm2≈7.5×10⁻⁵ eV2 θ12
Long Baseline Oscillations The KamLAND experiment uses neutrinos from 69 reactors to measure the solar mixing angle (θ12) at an average baseline of 180 km. Scatter plot of energies for the prompt and delayed signals Neutron Capture on Hydrogen results in a 2.2 MeV gamma In 145 days of running they saw 54 events where 86.8±5.6 events where expected. The fit energy confirms the oscillation hypothesis.
Long Baseline Oscillations KamLAND Results Eliminates all but the large mixing angle (LMA) solution. The best fit sin22θ12= 0.91 The best fit Δm2 = 6.9×10⁻⁵ eV2 The Δm2 sensitivity comes primarily from the solar measurements
Future Experiments to Search for a Non-zero Value of sin22θ13 Subject of a lot of interest because of it relevance to lepton CP violation and neutrino mass hierarchy. See Whitepaper: hep-ex/0402041
Sin22θ13 Reactor Experiment Basics νe νe νe νe νe νe sin22θ13 Well understood, isotropic source of electron anti-neutrinos Oscillations observed as a deficit of νe Eν≤ 8 MeV 1.0 Unoscillated flux observed here Probability νe Survival Probability Distance 1200 to 1800 meters
What is the Right Way to Design the Experiment? Start with the dominate systematic errors from previous experiments and work backwards… CHOOZ Systematic Errors, Normalization Near Detector Identical Near and Far Detectors The combination of these two plus a complex analysis gives you the anti-neutrino flux Movable Detectors, Source Calibrations, etc. CHOOZ Background Error BG rate0.9% Muon Veto and Neutron Shield (MVNS) Statistics may also be a limiting factor in the sensitivity.
Backgrounds • There are two types of background… • Uncorrelated − Two random events that occur close together in space and time and mimic the parts of the coincidence. • This BG rate can be estimated by measuring the singles rates, or by switching the order of the coincidence events. • Correlated − One event that mimics both parts of the coincidence signal. • These may be caused fast neutrons (from cosmic m’s) that strike a proton in the scintillator. The recoiling proton mimics the e+ and the neutron captures. • Or they may be cause by muon produced isotopes like 9Li and 8He which sometimes decay to β+n. • Estimating the correlated rate is much more difficult!
Veto Detectors p n n m m Reducing Background • Go as deep at you can(300 mwe → 0.2 BG/ton/day at CHOOZ) • Veto m’s and shield neutrons(Big effective depth) • Measure the recoil proton energy and extrapolate into the signal region.(Understand the BG that gets through and subtract it) Shielding 6 meters
Isotope Production by Muons A ½ second veto after every muon that deposits more that 2 GeV in the detector should eliminate 70 to 80% of all correlated decays. The vetoed sample can be used to make a background subtraction of in a fit to the energy spectrum.
Movable Detector Scenario The far detector spends about 10% of the run at the near site where the relative normalization of the two detectors is measured head-to-head. Build in all the calibration tools needed for a fixed detector system and verify them against the head-to-head calibration. 1500 to 1800 meters
Reactor Sensitivity • Sensitivity to sin22θ13 ≤ 0.01 at 90% CL is achievable. • Combining with off-axis some of the CP phase, δ, range can be ruled out. • Unexpected results are possible & might break the standard model.
Reactor Sensitivity Is the mixing angle θ23 is not exactly 45º then sin2θ23 has a two-fold degeneracy. Combining reactor results with off-axis breaks this degeneracy. With the 0.03 precision of the Double Chooz experiment the degeneracy is not broken.
Aggressive Experiment Timeline 2003 Years 2004 2005 2006 2007 2008 2009 2010 2011 Site Selection Proposal Construction Run 1 year 2 years 2 years3 years (initially) Site Selection: Currently underway. The early work on a proposal is currently underway. With movable detectors, the detectors are constructed in parallel with the civil construction Run Phase: Initially planned as a three year run. Results or events may motivate a longer run.
Conclusions and Prospects • Reactor neutrinos are relevant to oscillations in all observed Δm2 regions. • The KamLAND experiment has been crucial to resolving the oscillation parameters in the solar Δm2 region. • There are many ideas for reactor θ13 experiments around the world and it is likely that more than one will go forward. • Controlling the systematic errors is the key to making this measurement. • With a 3+ year run, the sensitivity in sin22q13 should reach 0.01 (90% CL) at Dm2 = 2.0×10⁻³. • Reactor sensitivities are similar off-axis and the two methods are complementary. • The physics of reactor neutrinos is interesting and important.
Why Use Gadolinium? Gd has a huge neutron capture cross section. So you get faster capture times and smaller spatial separation. (Helps to reduce random coincidence backgrounds) ~30 μs With Gd Without Gd With Gd Without Gd ~200 μs Also the 8 MeV capture energy (compared to 2.2 MeV on H) is distinct from primary interaction energy.
Characterizing BG with Vetoed Events Matching distributions from vetoed events outside the signal region to the non-veto events will provide an estimate of correlated backgrounds that evade the veto. • Other Useful Distributions: • Spatial separation prompt and delayed events • Faster neutrons go farther • Radial distribution of events • BGs accumulate on the outside of the detector. n interactions Proton recoils ? From CHOOZ
Medium Baseline Oscillation Searches • Homogeneous detector • 5 ton, Gd loaded, scintillating target • 300 meters water equiv. shielding • 2 reactors: 8.9 GWthermal • Baselines 1115 m and 998 m • Used new reactors → reactor off data for background measurement Chooz Nuclear Reactors, France
Palo Verde Palo Verde Generating Station, AZ • 32 mwe shielding(Shallow!) • Segmented detector: • Better at handling the cosmic rate of a shallow site • 12 ton, Gd loaded, scintillating target • 3 reactors: 11.6 GWthermal • Baselines 890 m and 750 m • No full reactor off running
Exelon has agreed to work with us to determine the feasibility of using their reactors to perform the experiment. “We are excited about the possibility of participating in a scientific endeavor of this nature” “At this time we see no insurmountable problems that would preclude going forward with this project.” They have given us reams of geological data which we are currently digesting.
Quantitative Analysis of Movable vs. Fixed Detectors Both the Kashiwazaki and Krasnoyarsk proposals assume that they can get the relative normalization systematic down to 0.8% with fixed detectors. Double Chooz believes that 0.6% is achievable. Even if you halve the relative normalization, fixed detector are not as sensitive for a two year (or longer) run. All fixed detector scenario quickly become systematics limited.
Optimal Far Baseline One must consider both the location of the oscillation maximum (~2200 m at Δm2=2×10⁻³) and statistics loss due to 1/r2 flux. Kinimatic Phase ≡ 1.27Δm2L/E for E=3.6 MeV At the preferred Dm2the optimal region is quite wide. In a configuration with a tunnel connecting the two detector sites, one should choose a far baseline that gives the shortest tunnel (1200 to 1400 meters).
Sensitivity Scaling with Systematic Error For a rate only analysis The optimal baseline is very sensitive to the level of systematic error. The standard assumption of 0.8% relative efficiency error for fixed detectors is ~250% of the statistical error after 3 years at Braidwood.
Comparison of Shape & Rate Statistics Limited Systematics Limited Systematic Error = 200% Systematic Error = 0% Systematic Error = 600% The optimal Baseline for the systematics limited shape analysis is ~40º. The optimal baseline for the systematics limited counting experiment is at the least optimal spot for a shape analysis! You better know what regime your working in.
Sensitivity wrt Near Baseline Ultimately the location of the near detector will be determined by the reactor owners. The main question here is what can we live with? There is a 1/r2 dependence in statistics (a small effect) and increasing oscillation probability with distance. Sensitivity degrades with increasing near baseline. When Lnear=Lfar the sensitivity is about the same as CHOOZ.