Download
1 / 22
220 likes | 321 Views
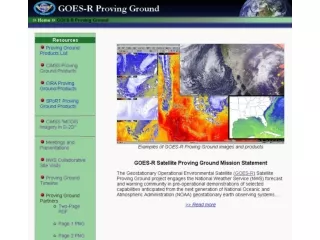
GOES-R Proving Ground Demonstration of Imagery Products at NOAA’s Storm Prediction Center and Hazardous Weather Testbed.

E N D
GOES-R Proving GroundDemonstration of Imagery Products at NOAA’s Storm Prediction Center and Hazardous Weather Testbed Chris Siewert1,6, Bob Rabin2,3, Darrel Kingfield1,2, Jason Otkin2, Daniel Lindsey4, Louis Grasso4, John Knaff4, Michael Folmer5, Andrew Molthan6, and Steven Weiss7 1 - OU-CIMMS, 2 - NOAA/NSSL, 3 - UW-CIMSS, 4 - CIRA, 5 - HPC/OPC/SAB/TAFB, 6 - NASA SPoRT, 7 - NOAA/NWS/SPC GOES-R Science Week 1 May 2012
NOAA’s Hazardous Weather Testbed Experimental Warning Program Experimental Forecast Program EWP EFP Detection and prediction of hazardous weather events up to several hours in advance Prediction of hazardous weather events from a few hours to a week in advance GOES-R PG
2011 Spring Experiment • 5-week period (9 May – 10 June) • During central plains peak severe weather season • Main focus on severe, QPF and CI • 24 NWS forecasters and many visiting scientists participated • 8 Proving Ground products demonstrated • Real-time forecast and warning exercises using operational decision support tools • N-AWIPS and AWIPS • Weather Event Simulator (WES) cases developed for training purposes
Simulated Satellite Imagery • Produced from the 0Z 4km NSSL-WRF • All 9 non-solar ABI IR bands • Visible band • Band differences • Hourly output available for 12-36 hr forecast periods • Most imagery available locally by 12Z • Now being produced in CAPS ensemble (2012) • Simulated IR in 23 members (28 overall) • Ensemble probability of cloud shield < -52 C and < -32 C
High Mid Low GOES-13
10-12 μm Channel Difference • Bands currently not available on GOES • 10.35 μm channel is a ‘clean’ window • Brightness temperature very sensitive to surface temperature • 12.3 μm channel is sensitive to column WV • Brightness temperature cools as WV increases • Difference becomes more positive as low- and mid-level WV increases
2011 Fire Weather Experiment • 2-week period (22 Aug. – 2 Sept.) • During western US fire weather season • Main focus on burnable fuels and dry thunder forecasting • 6 NWS forecasters and several internal guests participated • SPC and Norman WFO • 6 Proving Ground products demonstrated • Real-time fire weather forecasts using N-AWIPS • Forecast 24-hour burnable fuels and dry thunder threat
NDVI / NDVI Change • NDVI = (NIR-VIS)/(NIR+VIS) • Relative index of green vegetation cover • Values range from 0-1 • Clear sky only from MODIS imagery • Updates every 2 weeks • Can be compared to land use maps • NDVI change calculated using last 2 NDVI composites • Identify regions of decreasing or increasing greenness • Updated monthly
2012 Spring Experiment • 6-week period (7 May – 15 June) • During central plains peak severe weather season • Main focus on severe and CI • 24 NWS forecasters and 15 visiting scientists invited • 2 new Proving Ground products • Sounder Airmass RGB and probabilistic SATCAST • Real-time forecast and warning exercises using operational decision support tools • N-AWIPS and AWIPS II • Weather Event Simulator (WES) cases and jobsheets sent to forecasters pre-arrival
Capturing Feedback • Real-time blogging http://goesrhwt.blogspot.com/ • During forecast/warning exercises • Participants are also encouraged to blog following forecast/warning exercises • Web-based surveys • Immediately following forecast/warning operations • Daily post-mortem discussions • Between visiting scientists and forecasters
Thank you for your attention! Chris.Siewert@noaa.gov http://goesrhwt.blogspot.com