Download
1 / 10
100 likes | 202 Views
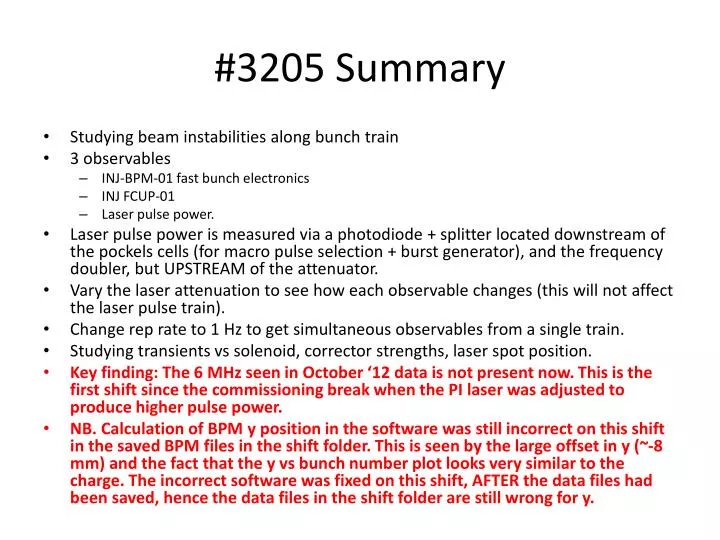
#3205 Summary. Studying beam instabilities along bunch train 3 observables INJ-BPM-01 fast bunch electronics INJ FCUP-01 Laser pulse power.

E N D
#3205 Summary • Studying beam instabilities along bunch train • 3 observables • INJ-BPM-01 fast bunch electronics • INJ FCUP-01 • Laser pulse power. • Laser pulse power is measured via a photodiode + splitter located downstream of the pockels cells (for macro pulse selection + burst generator), and the frequency doubler, but UPSTREAM of the attenuator. • Vary the laser attenuation to see how each observable changes (this will not affect the laser pulse train). • Change rep rate to 1 Hz to get simultaneous observables from a single train. • Studying transients vs solenoid, corrector strengths, laser spot position. • Key finding: The 6 MHz seen in October ‘12 data is not present now. This is the first shift since the commissioning break when the PI laser was adjusted to produce higher pulse power. • NB. Calculation of BPM y position in the software was still incorrect on this shift in the saved BPM files in the shift folder. This is seen by the large offset in y (~-8 mm) and the fact that the y vs bunch number plot looks very similar to the charge. The incorrect software was fixed on this shift, AFTER the data files had been saved, hence the data files in the shift folder are still wrong for y.
INJ-BPM-01 fast bunch electronics RAW DATA x y charge 15 pC 21 pC 30 pC 43 pC 60 pC Note significant droop in all 3 observables Small transient at start of train
Frequency Content, Pre-Processing • Take bunches 100 bunches to 1000 to avoid early transient and later droop • As always, subtract mean from data.
BPM frequency content, 0 – 1 MHz Strong 300 kHz 100 kHz not apparent
BPM frequency content, 0 – 8 MHz NO 6MHz
Faraday Cup Fourier Analysis • FCUP taken at 15 pC, 21 pC, 30 pC, 43 pC, 60 pC, simultaneously with the BPM shots on previous slides (use rep rate 1 Hz) • Scope records at 10 Gs/sec = 0.1 ns data spacing • Take 1 in every 10 data points effectively 1 Gs/sec = 1 ns data spacing • Take the same portion of the train 100 1000 bunches == 6 60 μs • Subtract the ‘background’ • Subtract the mean FCUP voltage • Take DFT
FCUP 60 pC example fcup after background subtraction 6-60 μs DFT for different frequency ranges 16 MHz + harmonics = bunch frequency 300 kHz lowest frequency is probably slope of data (slope still present even with background subtraction)
F-cup Fourier 15 pC 21 pC 30 pC 43 pC 60 pC
PI laser trace • PI laser trace taken at 15 pC, 21 pC, 30 pC, 43 pC, 60 pC, simultaneously with the BPM shots on previous slides (use rep rate 1 Hz) • Take ALL data points (do not do 1/10 sampling like for FCUP). 10 Gsamples/sec = 0.1 ns data spacing • No other filtering/binning performed i.e. maximum information retained. • Remember PI laser power is measured downstream of frequency doubler (green laser), but upstream of attenuation
PI Laser Fourier 15 pC 21 pC 30 pC 43 pC 60 pC