Download
1 / 13
160 likes | 265 Views
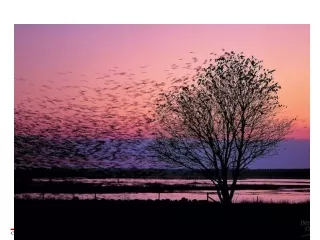
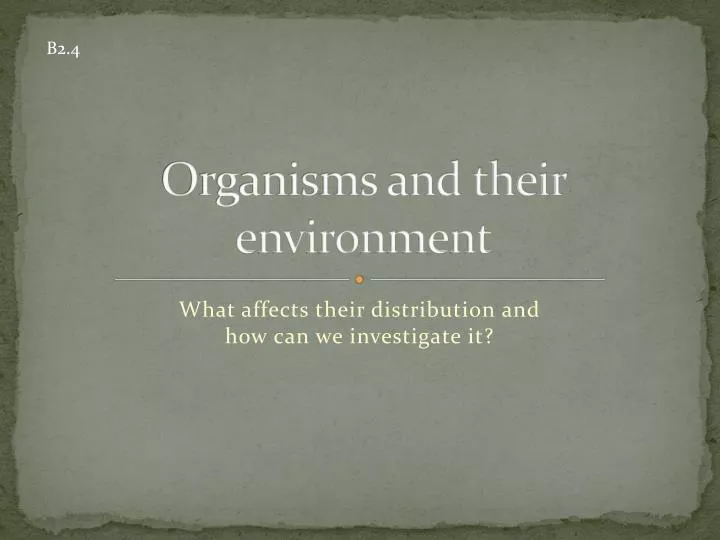
B2.4. Organisms and their environment. What affects their distribution and how can we investigate it?. What do you need to survive?. In groups LIST what your main needs will be as the following organisms: A dandelion An actual lion A Burmese python Mould on some cheese A bee An oak tree

E N D
B2.4 Organisms and their environment What affects their distribution and how can we investigate it?
What do you need to survive? • In groups LISTwhat your main needs will be as the following organisms: • A dandelion • An actual lion • A Burmese python • Mould on some cheese • A bee • An oak tree • Tuberculosis bacteria
Organisms need resources! • Physical factors may affect the distribution of organisms, including: • Temperature • Amount of light • Availability of: • Oxygen • Carbon dioxide • Water • Nutrients • Write these into your notes with a different example and organism for each one.
A quick maths reminder • Mean: add up all the numbers and then divide by the number of numbers (answer: 36/9 = 4) • Mode: the value that occurs most often (answer: 2) • Median: the "middle" value in the list of numbers when they are arranged in numerical order (answer: 2 2 2 3 4 4 5 5 9) • Range: the difference between the largest and smallest values (answer: 9 – 2 = 7) • Define the following terms in as few words as possible, then find them for these numbers: 2 4 9 3 5 2 4 2 5 • Mean • Mode • Median • Range
Counting daisies • There are two main kinds of data that we can gather for the daisies in this field: • Qualitative: ‘there are lots of daisies in the field’ • Quantitative: ‘there are 5087 daisies in the field’ • Quantitative data gives a specific measure for your subject, but qualitative data only gives a rough idea. • Quantitative data is usually more useful… …why do you think this is?
How many did you count? • How did you estimate the number of daisies? • Did you try to count them all? • Or did you use another method? • We need a quantitative estimate for the number of daisies – it doesn’t have to be perfect but it should be as close as possible to the real number. • Write your first estimate down, then try again, seeing if this will help…
Is your estimate the same? • If you were asked to count the number of daisies in the school field, it would be impractical to count each one. • How could you use the grid method to get an accurate, reproducible estimate? Make a rough plan. • Use your plan to make an estimate for the next field:
Quadrats: Top Tips • They only work for immobile/slow moving populations. • The more data you collect, the more reproducible your result…the more samples the better! • Quadrats should be placed randomly to avoid bias. • If you don’t know the exact size of your field you can estimate the percentage cover by seeing what percentage of each quadrat contains the organism and calculating the mean.
Finding a trend • How do you think the abundance of bluebells changes depending on how deep into this woodland you go? • By placing one quadrat each metre along a straight line you can find the % cover for different distances. This is called ‘sampling along a transect’. • This can be used to show a trend – what would you do with the results on the following slide?
Bluebell abundance in woodland Click to reveal…
Graph of results Click to reveal…
Quant vs. Qual again… • Because we have quantitative results we can specifically say how the trend develops – it starts at 18% for 1m, increases rapidly to 61% for 6m but levels out at 68% for 8m. • If we’d only had qualitative results we’d only be able to say ‘there are more bluebells the further in you go’ – not much good! • You must include references to data when describing trends!
What have we learned? • Physical factors may affect the distribution of organisms, including: • water, light, nutrients, oxygen, carbon dioxide and temperature • Quantitative data on the distribution of organisms can be obtained by: • random sampling with quadrats to estimate a number or percentage • sampling along a transect to find a trend