Download
1 / 20
200 likes | 257 Views
Incremental Call-Path Profiling. Andrew Bernat bernat@cs.wisc.edu Computer Sciences Department University of Wisconsin-Madison Madison, WI 53706 USA. main. do_work. main. lookup. malloc. do_work. hash_lookup. MPI_Recv. strcpy. Point Profiler (Length 1). main. do_work. 96% CPU.

E N D
Incremental Call-Path Profiling Andrew Bernat bernat@cs.wisc.edu Computer Sciences Department University of Wisconsin-Madison Madison, WI 53706 USA Dynamic Call-Path Profiling
main do_work
main lookup malloc do_work hash_lookup MPI_Recv strcpy
Point Profiler (Length 1) main do_work 96% CPU
Edge Profiler (Length 1) main 40% 53% do_work 96% CPU
Path Profiler (Length 3) main 50% 36% 40% 53% do_work 96% CPU
Full Call-Path Profiling main 53% 43% 50% 36% 40% 53% do_work 96% CPU
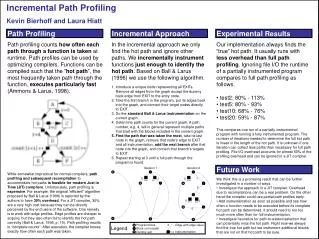
Call-Path Profiling Disassembled • Profiling functions is easy • Determining the call-path is hard • Efficiency – cost per function invocation • Safety – must not affect program’s behavior • Correctness
Call-Path Profilers • Provide path-profile data for every function in the program. • Two categories: • Sample-based (gprof, CPPROF) • Instrumenting profilers (PP, TAU, others)
Sampling Call-Path Profilers • Periodically pause the program • Note active function • Record call-path (current stack) • Some profilers sample CPU usage • Advantages: • Complete call-path information • Disadvantages: • Imprecise (sampling-based) • Limited metrics available
Instrumenting profilers • Track the current call-path • Stack of active functions • Maintain a pointer to the current call-path • Record metrics for all functions • Counters, CPU usage, wall time • Disadvantages • Incomplete (can miss recursion, dynamic calls) • Expensive (instrumentation at entries, exits, call sites) • Only supports limited, inexpensive metrics
Incremental, Dynamic Call-Path Profiling • Incremental: Only profile functions of interest to the user • “Paradyn approach” • Dynamic: Allow “on-the-fly” profiling • Global analysis unnecessary • Cost Effective: Reduce overall cost • Complete: User still gets complete call-path information
Incremental, Dynamic Call-Path Profiling • Capture the call-path with a stack walk from within the process. • Includes dynamic calls and recursion • Makes tracing function calls unnecessary • Walk the stack at function entries and exits. • Cost only incurred when profiled functions are executed. • Allows use of more expensive metrics
iPath, a Prototype Incremental Call-Path Profiler • Allows use of arbitrary performance metrics. • PMAPI (AIX), PAPI (Linux) • Counters, timers, and arbitrary combinations • Profiles user-selected functions • Uses Dyninst • Traces unmodified binaries
iPath Implementation • Instrumentation is contained in a run-time library. • User defines wanted metrics • Maintain a table for each function profiled • Stack walk and associated performance data for each detected call-path • Update the table at function entry and exit • Results available on the fly
iPath in Action • We applied iPath to two applications: the Paradyn daemon and the MILC QCD simulation framework. • Paradyn daemon: identified and fixed a serious bottleneck in address -> function mapping. • MILC: identified and fixed a communication bottleneck.
Paradyn Daemon • Top level: Performance Consultant was slow • Identified a bottleneck in address -> function mapping. • Parsing: target of a call-site • Runtime: identifying functions on the stack • Call-path analysis showed the lookup function performed horribly along only one path. • We optimized the function for that path. • Result: 98% decrease in instrumentation time!
MILC • Parallel computation framework for quantum chromodynamics simulations. • We analyzed MPI performance using iPath and focused on frequently executed paths. • We identified two bottlenecks, one of which we fixed. • We reduced the number of times MPI functions were called and replaced calls to reduce synchronization time. • Result: 45% decrease in execution time
Summary • Call-path profiling is a useful technique, but current methods are incomplete. • Increase flexibility and reduce cost by profiling particular functions instead of the whole program. • Come see the demo!