Download
1 / 1
10 likes | 113 Views
INTERANUAL VARIABILITY OF PRECIPITATION IN LA PLATA BASIN AND EL NINO (CANONICAL AND MODOKI) - BEHAVIOR OF HADLEY AND GFDL MODELS. Renata G. Tedeschi 1 (rgtedeschi@gmail.com), Iracema F. A. Cavalcanti 1 (iracema.cavalcanti@gmail.com), Alice M. Grimm 2 (grimm@fisica.ufpr.br).

E N D
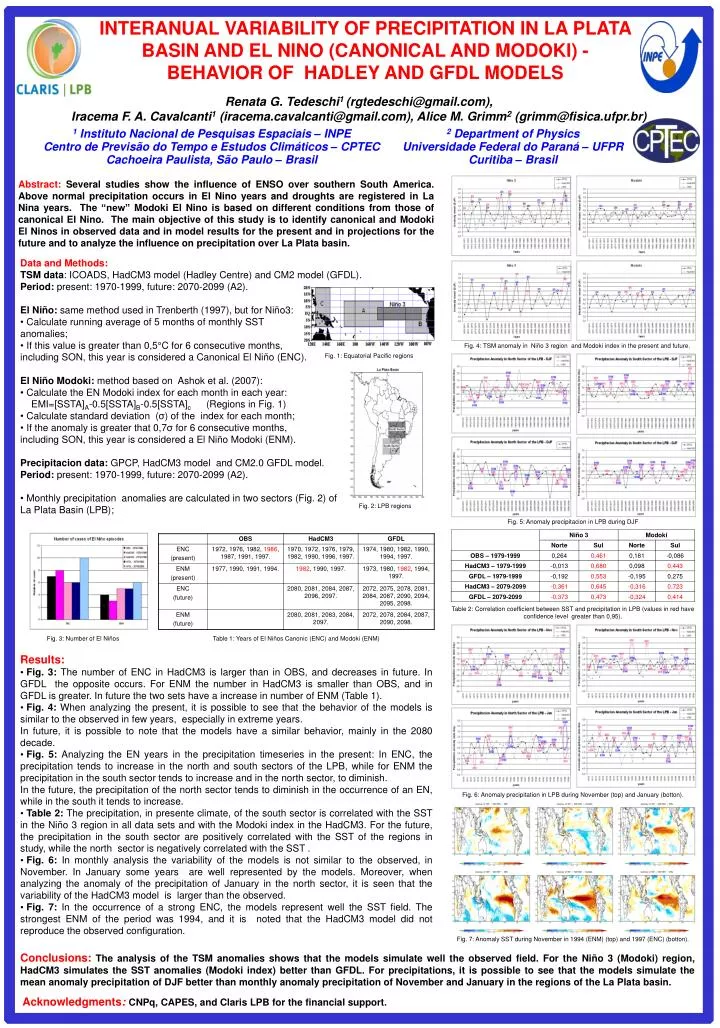
INTERANUALVARIABILITY OF PRECIPITATION IN LA PLATA BASIN AND EL NINO (CANONICAL AND MODOKI) - BEHAVIOR OF HADLEY AND GFDL MODELS Renata G. Tedeschi1 (rgtedeschi@gmail.com), Iracema F. A. Cavalcanti1 (iracema.cavalcanti@gmail.com), Alice M. Grimm2 (grimm@fisica.ufpr.br) 1 Instituto Nacional de Pesquisas Espaciais – INPE Centro de Previsão do Tempo e Estudos Climáticos – CPTEC Cachoeira Paulista, São Paulo – Brasil 2 Department of Physics Universidade Federal do Paraná – UFPR Curitiba – Brasil Abstract: Several studies show the influence of ENSO over southern South America. Above normal precipitation occurs in El Nino years and droughts are registered in La Nina years. The “new” Modoki El Nino is based on different conditions from those of canonical El Nino. The main objective of this study is to identify canonical and Modoki El Ninos in observed data and in model results for the present and in projections for the future and to analyze the influence on precipitation over La Plata basin. Data and Methods: • TSM data: ICOADS, HadCM3 model (Hadley Centre) and CM2 model (GFDL). • Period: present: 1970-1999, future: 2070-2099 (A2). • El Niño: same method used in Trenberth (1997), but for Niño3: • Calculaterunning averageof 5 months of monthly SST • anomalies; • If this value is greater than 0,5°C for 6 consecutive months, • including SON, this year is considered a Canonical El Niño (ENC). • El Niño Modoki: method based on Ashok et al. (2007): • Calculate the EN Modoki index for each month in each year: • EMI=[SSTA]A-0.5[SSTA]B-0.5[SSTA]c (Regions in Fig. 1) • Calculate standard deviation (σ) of the index for each month; • If the anomaly is greater that 0,7σfor 6 consecutive months, • including SON, this year is considered a El Niño Modoki (ENM). • Precipitacion data: GPCP, HadCM3 model and CM2.0 GFDL model. • Period: present: 1970-1999, future: 2070-2099 (A2). • Monthly precipitation anomalies are calculated in two sectors (Fig. 2) of • La Plata Basin (LPB); Fig. 4: TSM anomaly in Niño 3 region and Modoki index in the present and future. Fig. 1: Equatorial Pacific regions Fig. 2: LPB regions Fig. 5: Anomaly precipitacion in LPB during DJF Table 2: Correlation coefficient between SST and precipitation in LPB (values in red have confidence level greater than 0,95). Fig. 3: Number of El Niños Table 1: Years of El Niños Canonic (ENC) and Modoki (ENM) Results: • Fig. 3: The number of ENC in HadCM3 is larger than in OBS, and decreases in future. In GFDL the opposite occurs. For ENM the number in HadCM3 is smaller than OBS, and in GFDL is greater. In future the two sets have a increase in number of ENM (Table 1). • Fig. 4: When analyzing the present, it is possible to see that the behavior of the models is similar to the observed in few years, especially in extreme years. In future, it is possible to note that the models have a similar behavior, mainly in the 2080 decade. • Fig. 5:Analyzing the EN years in the precipitation timeseries in the present: In ENC, the precipitation tends to increase in the north and south sectors of the LPB, while for ENM the precipitation in the south sector tends to increase and in the north sector, to diminish. In the future, the precipitation of the north sector tends to diminish in the occurrence of an EN, while in the south it tends to increase. • Table 2: The precipitation, in presente climate, of the south sector is correlated with the SST in the Niño 3 region in all data sets and with the Modoki index in the HadCM3. For the future, the precipitation in the south sector are positively correlated with the SST of the regions in study, while the north sector is negatively correlated with the SST . • Fig. 6: In monthly analysis the variability of the models is not similar to the observed, in November. In January some years are well represented by the models. Moreover, when analyzing the anomaly of the precipitation of January in the north sector, it is seen that the variability of the HadCM3 model is larger than the observed. • Fig. 7: In the occurrence of a strong ENC, the models represent well the SST field. The strongest ENM of the period was 1994, and it is noted that the HadCM3 model did not reproduce the observed configuration. Fig. 6: Anomaly precipitation in LPB during November (top) and January (botton). Fig. 7: Anomaly SST during November in 1994 (ENM) (top) and 1997 (ENC) (botton). Conclusions:The analysis of the TSM anomalies shows that the models simulate well the observed field. For the Niño 3 (Modoki) region, HadCM3 simulates the SST anomalies (Modoki index) betterthan GFDL. For precipitations, it is possible to see that the models simulate the mean anomaly precipitation of DJF better than monthlyanomaly precipitation of November and January in the regions of the La Plata basin. Acknowledgments:CNPq, CAPES, and Claris LPB for the financial support.