Download
1 / 45
450 likes | 552 Views
LBA Flux Tower Workshop. Software Intercomparison. Celso von Randow Ganabathula Prasad CPTEC/INPE. December 2001. Quality control – Vickers & Mahrt (1997). Software intercomparison. Flux sampling problems – Mahrt (1998) Surface heterogeneity, complex terrains Nonstationarity

E N D
LBA Flux Tower Workshop Software Intercomparison Celso von Randow Ganabathula Prasad CPTEC/INPE December 2001
Quality control – Vickers & Mahrt (1997) Software intercomparison • Flux sampling problems – Mahrt (1998) • Surface heterogeneity, complex terrains • Nonstationarity • Random Flux Errors • Systematic underestimation of low frequency fluxes • Sensitivity of flux calculations • Results of intercomparison among LBA flux measurements
Spike Removal Insufficient Amplitude Resolution Drop outs Absolute Limits Skewness and Kurtosis Discontinues- Haar mean, Haar var. Lag Correlation – Not used. Vertical Profile – Not used. Quality control for Sonic Data
Electronic spikes to have a max. width of 3 consecutive points in the time series and more than 3.5 standard deviations from the window mean (L=3000 points =5min@10Hz) The point is replaced using linear interpolation between data points. The record is flagged when the total number of spikes replaced exceeds 1% of the total number of data points Spike Removal
Compute a series of discrete frequency distributions for half-overlapping windows of length 1,000 data points The window move one-half the window width at a time through the series the number of bins is 100 and the interval for the distribution is min(range, 7). Flagged if number of empty bins in the discrete frequency distribution >70% Insufficient Amplitude Resolution
Consecutive points that fall into the same bin are tentatively identified as dropouts Max no of consecutive dropouts as % of total window points same window and frequency distributions used for the resolution problem if bin is within 10% and 90% tentiles of distribution, compare with threshold. Drop outs
|u|> 30 m/s |v| > 30m/s |w| > 5 m/s T < 275 K (2 C) & T> 323 K (50 C) H2O< 2 & H2O> 40 g/kg Absolute Limits
Detrend record Skewness [-2 2] (Empirical value) Kurtosis [1 8] (Empirical value) Skewness and Kurtosis
Haar transform of window Normalize with the smallest S.D. Discontinuity if Haar mean >3 Discontinuites
Systematic Error: failure to capture all the largest transporting eddies– underestimation of flux. Random Error: Inadequate sampling of main transporting eddies, inadequate record size. Mesoscale variability: inhomogeneity of flow. Dependence of flux on choice of scale. Flux Sampling Errors
Relative Systematic Error: < w’’>L2 - < w’’>L1 < Th < w’’>L1 Systematic Error
Partition record into non overlapping subrecords (i=1,2,…) Average Flux Fi=<Fi> +Ftr + F*i Ftr = a0 + a1t using a Least Squares fit. RFE = F* |<Fi>| -1 N-0.5 RN = Ftr|<Fi>| -1 N-0.5 Random Error
Measure of Isolated flux event: Max(Fi) |<Fi>| -1 Fi is the aver sub-record flux <Fi> is the record mean value of Fi Flux Event
No of Records 44 RFE RN EVT RSE FSR WU 5 3 48 1 0 WV 45 9 48 34 15 WT 6 5 48 3 0 WH2O 18 6 48 11 0 Preliminary Results on Santarem km67Day 267
Averaging time scales Rotations Block averaging / Linear detrending / Recursive digital filter Low frequency corrections Uncertainties Sensitivity of flux calculations
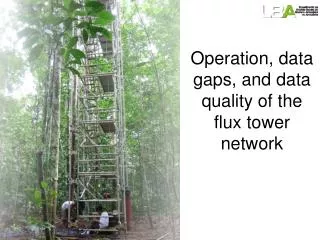
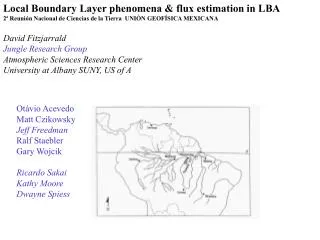
LBA tower sites • Rondônia • Rebio Jaru forest – Primary forest • Fazenda Nossa Senhora) - Pasture • Manaus • Tower K34 – Primary forest • Tower C14 – Primary forest • Santarém • Tower Km 67 – Primary forest • Tower km 83 – Logged forest (primary) • Tower km 77 – Pasture site
LBA tower sites • Caxiuanã • Primary forest • Brasília • Cerrado • Campo Sujo (Biennial fire regime) • Campo Sujo (Quadriennial fire regime) • Mato Grosso • Sinop Forest • Bragança • Mangrove • Venezuela – Savanna site
Softwares used in intercomparison • Vickers & Mahrt Software (Oregon St. Univ.) • 2 rotations; • Block averaging • Discard records with high random flux errors and nonstationarity + Softwares used in LBA flux sites • Rondônia, Manaus – EddyWSC v.2 (Alterra) • 3 rotations; • Digital recursive filter (800 s time constant); • Low frequency corrections
Santarém, km 83 – EddyWSC v.1 (Alterra) • 3 rotations; • Digital recursive filter (200 s time constant); • Santarém, km 67 – CD-10 Program (Harvard Univ.) • Santarém, Pasture – CD-03 Program (ASRC, Albany) • Caxiuanã – Edisol (Univ. of Edinburgh) • Brasília – EddySoft package (MPI) • 3 rotations; • Linear detrending; • Venezuela – Edisol (Univ. of Edinburgh)
CD-10 x Vickers & Mahrt Software ~ dry season
200 s x 800 s time constant CD-04 x EddyWSC
Eddysoft package x EddyWSC ~ dry season
Fluxes calculated by different LBA groups might give quite different values specially considering different parameters (averaging time scale; corrections; etc) In summary... • As fluxes calculations in complex terrains are very sensitive to parameters like rotations and averaging time scales, LBA groups should be VERY CAREFUL when integrating or comparing measurements from different groups. • Softwares used by a few groups (Rondonia/Manaus, Santarém km 67, Caxiuanã/Bragança) agree within + 6 %. • Softwares used by groups CD-03, CD-04, Brasilia and Venezuela calculated substantially lower fluxes than other programs (averaging time scales ? corrections ? )
Jair F. Maia Maria Betânia L. de Oliveira Paulo Kubota Acknowledgements
Continue software intercomparison Put together a “golden” data set that can be run by each group on their own program; Suggestions for (near) future • Integration of measurements on large scale • Standardize software parameters ? • How do the differences are reflected in long term budgets ? • Are the differences the same in positive (respiration) and negative (assimilation) fluxes ?