Download
1 / 35
350 likes | 515 Views
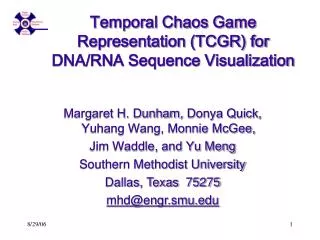
Temporal Chaos Game Representation (TCGR) for DNA/RNA Sequence Visualization. Margaret H. Dunham , Donya Quick, Yuhang Wang, Monnie McGee, Jim Waddle, and Yu Meng Southern Methodist University Dallas, Texas 75275 mhd@engr.smu.edu. Outline. Introduction CGR/FCGR miRNA Motivation

E N D
Temporal Chaos Game Representation (TCGR) for DNA/RNA Sequence Visualization Margaret H. Dunham, Donya Quick, Yuhang Wang, Monnie McGee, Jim Waddle, and Yu Meng Southern Methodist University Dallas, Texas 75275 mhd@engr.smu.edu
Outline • Introduction • CGR/FCGR • miRNA • Motivation • Research Objective • TCGR • EMM • miRNA Prediction using TCGR/EMM • Conclusiont/Future Work
Outline • Introduction • CGR/FCGR • miRNA • Motivation • Research Objective • TCGR • EMM • miRNA Prediction using TCGR/EMM • Conclusion/Future Work
Chaos Game Representation (CGR) Scatter plot showing occurrence of patterns of nucleotides. University of the Basque Country http://insilico.ehu.es/genomics/my_words/
A A A A A A A A A A A A A A A A C C C C C C C C C C C C C C C C G G G G G G G G G G G G G G G G U U U U U U U U U U U U U U U U FCGR Chaos Game Representation (CGR) • 2D technique to visually see the distribution of subpatterns • Our technique is based on the following: • Generate totals for each subpattern • Scale totals to a [0,1] range. (Note scaling can be a problem) • Convert range to red/blue • 0-0.5: White to Blue • 0.5-1: Blue to Red
AGA GAA GA AA CGA CAG CAA CGG TGG TAA AG GGG AAA GG AAG GGA AGG GAG TGA TAG TGC GC AT TAT GT AAC AC AAT TGT CGC CGT AGT CAT CAC GGT GAT GAC GGC AGC TAC TTA TTG GCA ACA ATA ACG ATG TCA TCG GCG GTG TG CCA GTA CG CTG CTA TA CA CCG ACT CC GTC GCT ATT ATC CT ACC TC GTT CCT CCC TTT GCC TCC TTC TCT CTC CTT TT A C G T c) Trinucletides a) Nucleotides b) Dinucleotides FCGR
FCGR Example Homo Sapiens – all maturemiRNA Patterns of length 3 UUC GUG
miRNA • Short (20-25nt) sequence of noncoding RNA • Single strand • Previously assumed to be garbage • Impact/Prevent translation of mRNA • Conserved across species(sometimes) • Reduce protein levels without impacting mRNA levels • Bind to target areas in mRNA – Problem is that this binding is not perfect (particularly in animals) • mRNA may have multiple (nonoverlapping) binding sites for one miRNA
miRNA Functions • Causes some cancers • Embryo Development • Cell Differentiation • Cell Death • Prevents the production of a protein that causes lung cancer • Control brain development in zebra fish • Associated with HIV
miRNA Research Issues • Predict/Find miRNA • Predict miRNA targets • Identify miRNA functions • Identify how miRNAs work
Motivation 2000bp Flanking Upstream Region mir-258.2 in C elegans a) All 2000 bp b) First 240 bp b) Last 240 bp
Research Objectives • Identify, develop, and implement algorithms which can be used for identifying potential miRNA functions. • Create an online tool which can be used by other researchers to apply our algorithms to new data.
Outline • Introduction • CGR/FCGR • miRNA • Motivation • Research Objective • TCGR • EMM • miRNA Prediction using TCGR/EMM • Conclusion/Future Work
Temporal CGR (TCGR) • Temporal version of Frequency CGR • In our context temporal means the starting location of a window • 2D Array • Each Row represents counts for a particular window in sequence • First row – first window • Last row – last window • We start successive windows at the next character location • Each Column represents the counts for the associated pattern in that window • Initially we have assumed order of patterns is alphabetic • Size of TCGR depends on sequence length and subpattern lengt • As sequence lengths vary, we only examine complete windows • We only count patterns completely contained in each window.
acgtgcacgtaactgattccggaaccaaatgtgcccacgtcga Moving Window TCGR Example A C G T Pos 0-8 2 3 3 1 Pos 1-9 1 3 3 2 … Pos 34-42 2 4 2 1 A C G T Pos 0-8 0.4 0.6 0.6 0.2 Pos 1-9 0.2 0.6 0.6 0.4 … Pos 34-42 0.4 0.8 0.4 0.2
TCGR Example (cont’d) TCGRs for Sub-patterns of length 1, 2, and 3
TCGR Example (cont’d) A C G T acgtgcacg cgtgcacgt tccggaacc ccggaacca ccacgtcga Window 0: Pos 0-8 Window 1: Pos 1-9 Window 17: Pos 17-25 Window 18: Pos 18-26 Window 34: Pos 34-42
TCGR – Viruses miRNA(Window=9; Pattern=1;2;3) EpsteinBarr HumanCytomegalovirus Kaposi sarc Herpesvirus Mouse Gammaherpesvirus Pattern=1 Pattern=2 Pattern=3
C Elegans Homo Sapiens Mus Musculus All Mature ACG CGC GCG UCG TCGR – Mature miRNA(Window=5; Pattern=3)
Outline • Introduction • CGR/FCGR • miRNA • Motivation • Research Objective • TCGR • EMM • miRNA Prediction using TCGR/EMM • Conclusion/Future Work
EMM Overview • Time Varying Discrete First Order Markov Model • Nodes are clusters of real world states. • Learning continues during prediction phase. • Learning: • Transition probabilities between nodes • Node labels (centroid of cluster) • Nodes are added and removed as data arrives
EMM Definition Extensible Markov Model (EMM): at any time t, EMM consists of an MC with designated current node, Nn, and algorithms to modify it, where algorithms include: • EMMCluster, which defines a technique for matching between input data at time t + 1 and existing states in the MC at time t. • EMMIncrement algorithm, which updates MC at time t + 1 given the MC at time t and clustering measure result at time t + 1. • EMMDecrement algorithm,which removes nodes from the EMM when needed.
EMM Cluster • Find closest node to incoming event. • If none “close” create new node • Labeling of cluster is centroid of members in cluster • O(n)
2/3 1/2 N3 2/3 N1 2/3 1/2 N3 1/3 1/1 N2 N1 N1 1/2 2/3 1/3 1/1 N2 1/3 N2 N1 1/3 N2 N3 1/1 1 N1 1/1 2/2 1/1 N1 EMM Increment <18,10,3,3,1,0,0> <17,10,2,3,1,0,0> <16,9,2,3,1,0,0> <14,8,2,3,1,0,0> <14,8,2,3,0,0,0> <18,10,3,3,1,1,0.>
Research Objectives • Identify, develop, and implement algorithms which can be used for identifying potential miRNA functions. • Create an online tool which can be used by other researchers to apply our algorithms to new data. Our approach: • Represent potential miRNA sequence with TCGR sequence of count vectors • Create EMM using count vectors for known miRNA (miRNA stem loops, miRNA targets) • Predict unknown sequence to be miRNA (miRNA stem loop, miRNA target) based on normalized product of transition probabilities along clustering path in EMM
Outline • Introduction • CGR/FCGR • miRNA • Motivation • Research Objective • TCGR • EMM • miRNA Prediction using TCGR/EMM • Conclusion/Future Work
Prediction of miRNA Precursors1 • Predicted occurrence of pre-miRNA segments form a set of hairpin sequences • No assumptions about biological function or conservation across species. • Used SVMs to differentiate the structure of hiarpin segments that contained pre-miRNAs from those that did not. • Sensitivey of 93.3% • Specificity of 88.1% • No report of false positives 1 C. Xue, F. Li, T. He, G. Liu, Y. Li, nad X. Zhang, “Classification of Real and Pseudo MicroRNA Precursors using Local Structure-Sequence Features and Support Vector Machine,” BMC Bioinformatics, vol 6, no 310.
Preliminary Test Data1 • Positive Training: This dataset consists of 163 human pre-miRNAs with lengths of 62-119. • Negative Training: This dataset was obtained from protein coding regions of human RefSeq genes. As these are from coding regions it is likely that there are no true pre-miRNAs in this data. This dataset contains 168 sequences with lengths between 63 and 110 characters. • Positive Test: This dataset contains 30 pre-miRNAs. • Negative Test: This dataset contains 1000 randomly chosen sequences from coding regions. 1 C. Xue, F. Li, T. He, G. Liu, Y. Li, nad X. Zhang, “Classification of Real and Pseudo MicroRNA Precursors using Local Structure-Sequence Features and Support Vector Machine,” BMC Bioinformatics, vol 6, no 310.
Preliminary Test Results • Positive EMM • Cutoff Probability = 0.3 • False Positive Rate = 0% • True Positive Rate = 66% • Test results could be improved by meta classifiers combining multiple positive and negative classifiers together.
Outline • Introduction • CGR/FCGR • miRNA • Motivation • Research Objective • TCGR • EMM • miRNA Prediction using TCGR/EMM • Conclusion/Future Work
Conclusion/Future Work This is ongoing research. Results, although promising, are preliminary. More research is ongoing.
Future Research • Obtain all known mature miRNA sequences for a species – initially the 119 C. elegans miRNAs. • Create TCGR count vectors for each sequence and each sub-pattern length (1,2,3,4,5). • Train EMMs using this data for each sub-pattern length. Thus five EMMs will be created • Obtain negative data (much as Xue did in his research) from coding regions for C Elegans. • Train EMMs using this data for each sub-pattern length. Thus five EMMs will be created • Construct a meta-classifier based on the combined results of prediction from each of these ten EMMs. • Apply the EMM classifier to the existing ~75x106 base pairs of non-exonic sequence in the C. elegans genome to search for miRNAs. Note: all 119 validated C. elegans miRNAs are contained in the non-exonic part of the genome and thus the first pass of the algorithm will be tested for its ability to detect all 119 validated miRNAs. • Validate the prediction of novel miRNAs using molecular biology.