Download
1 / 22
220 likes | 405 Views
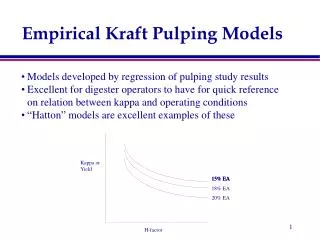
Creating Empirical Models. Constructing a Simple Correlation and Regression-based Forecast Model Christopher Oludhe, Department of Meteorology, University of Nairobi Clips training workshop for Eastern and Southern Africa, DMCN. 30 th July 2002. Simple Linear Correlation Analysis.

E N D
Creating Empirical Models Constructing a Simple Correlation and Regression-based Forecast Model Christopher Oludhe, Department of Meteorology, University of Nairobi Clips training workshop for Eastern and Southern Africa, DMCN. 30th July 2002
Simple Linear Correlation Analysis • Many problems in seasonal climate prediction start by trying to establish some relationship (linear) between two sets of variables. • An example would be to try and see whether the (SST) over any of the global oceans (variable one) is related to rainfall (variable two) at a certain given location of the globe.
Simple Linear Correlation Cont.. • The Knowledge of such a relationship would be useful in that the expected rainfall of the given location can be predicted if the SSTs of the global Oceans are known in advance. • The strength of the two relationship can be determined by computing the Pearson’s coefficient of correlation, r.
Simple Linear Correlation Cont.. • The statistical significance of the computed correlation coefficient r may be tested by using the t- statistic given by: • Accept or reject your null hypothesis ( r = 0) depending on the results of the comparison between computed and tabulated t.
Simple Linear Regression Equation • A simple linear regression equation gives the functional relationship between two variables such as: Y = + x where x is the independent variable (predictor) and Y the dependent variable (response or predictand). • The estimation of the regression constants, (Y-intercept) and (slope of the line), are possible through the method of least-squares.
Regression Cont.. • The solutions for the regression constants are given by the relations: and
Plotting of paired data • Given a set of paired standardised rainfall (Y ) and SST (X ) data below • i xi yi i xi yi • 1 -1.3719 -0.2179 11 0.0670 0.4004 • 2 -0.4962 0.9133 12 0.0131 -1.0518 • 3 0.9218 -0.4753 13 1.7473 -1.2373 • 4 -1.8650 2.0254 14 0.3468 -1.0691 • 5 -1.0855 0.4186 15 -0.2330 -0.4616 • 6 -1.8062 2.1255 16 0.0106 -0.6662 • 7 0.0720 0.3577 17 1.0150 -0.9299 • 8 0.5173 -0.0106 18 1.5223 1.5044 • 9 0.2192 -0.8236 19 -0.7204 0.2140 • 10 0.7199 -0.5498 20 0.4061 -0.4662
Linear Regression Fit • It can be seen that the relationship is linear but negatively, i.e. when the SST index increases (decreases), the rainfall index decreases (increases), i.e, positive SST index are associated with a negative rainfall index, or drier than average conditions. • Using this type of relationship, it is possible to make a qualitative statement regarding the expected rainfall for a coming season if knowledge of the seasonal lag SST index can obtained just before the beginning of the season to be forecasted.
Goodness of fit measure • The goodness of “fit” of a regression model can be determined by examining the mean-squared error (MSE) in the ANOVA table output. • This measure indicates the variability of the observed values around the forecast regression line. A perfect linear relationship between the predictor and predictand gives an MSE of zero, while poor fits results in large values of MSE. • Another measure of the fit of a regression is the coefficient of determination (R2) which is, the squared value of the Pearson correlation coefficient between predictor and predictand.
Measure Cont.. • Qualitatively, R2 can be interpreted as the proportion of the variance of the predictand that is described or accounted for by the regression. • For a perfect regression, the R2 = 1, while for R2 close to 0 indicates that very little of the variance is being explained by the regression line. • In majority of applications, however, the response of a predictand can be predicted more adequately by a collection of many variables and not just on the basis of a single independent input variable.
Multiple Linear Regression • In a multiple linear regression model, a single predictant, Y, (e.g. SOND rainfall) has more than one predictor variable, i.e, it can be influenced by ENSO, QBO, SSTs over the Indian Ocean AND/OR the Atlantic Ocean, etc. • For K predictors: Y = β0 + β1x1 + β2x2 + … + βkxk • The procedure for estimating the regression coefficients is the same as those for simple linear regression models.
Stepwise Regression analysis • Forward Selection: In this procedure, only the best potential predictors that improves the model the most, are examined individually and added into the model equation, starting with the one that explains the highest variance, etc. • Backward Elimination: The regression model starts with all potential predictors and at each step of model construction, the least important predictor is removed until only the best predictors remain. • A stopping criteria should be selected in both cases.
Forecast Skill Estimation(Contingency Table) A: Above-normal N: Near-normal B: Below-normal O: Observed F: Forecast
Accuracy Measures of Multicategory Forecasts (1) • Hit Score (HS): Number of times a correct category is forecast • HS = R+V+Z
Accuracy Measures of Multicategory Forecasts (2) • False Alarm Ratio (FAR): The fraction of forecast events that failed to materialize • Best FAR=0; worst FAR=1 • For Above-Normal=(S+T)/(R+S+T) • For Near-Normal=(U+W)/(U+V+W) • For Below-Normal=(X+Y)/(X+Y+Z)
Accuracy Measures of Multicategory Forecasts (3) • Bias: Comparison of the average forecast with the average observation • Bias > 1 : overforecasting • Bias < 1 : underforecasting • For Above-Normal=(R+S+T)/(R+U+X) • For Near-Normal=(U+V+W)/(S+V+Y) • For Below-Normal=(X+Y+Z)/(T+W+Z)
Example of Model Testing (1) Regression lines for some of the 20 cross-validation models: Mod. 1: Y1= 0.0579-0.6434x (years 2 to 20) Mod. 2: Y2=-0.0339-0.5421x (year 1 and 3 to 20) : Mod. 18: Y18=-0.1423-0.7878x (years 1 to 17 and 19 and 20) : Mod. 20: Y20= 0.0127-0.5543x (years 1 to 19)
Example of Model Testing (2)Linear Fits of the 20 cross-validation models. The red line is the fit of Model 18 which excludes the outlier at about (1.5,1.5)
Example of Model Testing (3)Cross-val. forecasts (dashed) and observed (solid) using data from 18 seasons. Horizontal lines on either side of zero line: upper and lower limits of Near-Normal
Example of Model Testing (4) HS=4+2+2 BIASA=(4+1+0)/(4+2+0); BIASN=(2+2+4)/(1+2+3); BIASB=(0+3+2)/(0+4+2) FARA=(1+0)/(4+1+0); FARN=(2+4)/(2+2+4); FARB=(0+3)/(0+3+2)