Download
1 / 1
10 likes | 134 Views
Orbit. Detections of Martian Aurora. SPICAM Night Side Observations Between 2004-07-07 (orbit 591) and 2006-01-15 (orbit 2581), SPICAM observed the Martian night side on 42 orbits 29 orbits in grazing limb mode 13 orbits in nadir mode Nightglow emissions detected on X orbits

E N D
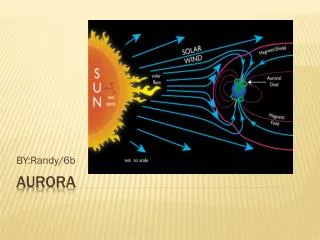
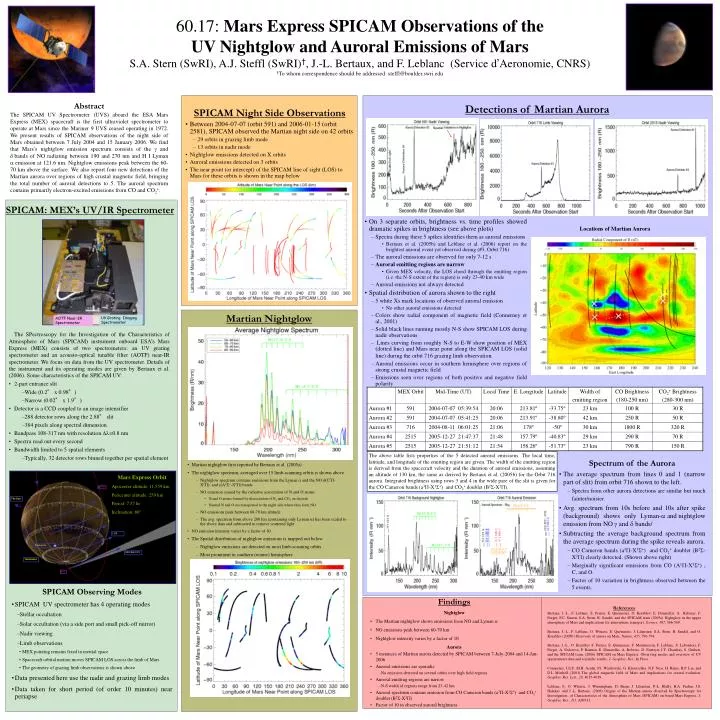
Orbit Detections of Martian Aurora • SPICAM Night Side Observations • Between 2004-07-07 (orbit 591) and 2006-01-15 (orbit 2581), SPICAM observed the Martian night side on 42 orbits • 29 orbits in grazing limb mode • 13 orbits in nadir mode • Nightglow emissions detected on X orbits • Auroral emissions detected on 3 orbits • The near point (or intercept) of the SPICAM line of sight (LOS) to Mars for these orbits is shown in the map below UV Grating Imaging Spectrometer AOTF Near-IR Spectrometer Spatial The Sun LOS • On 3 separate orbits, brightness vs. time profiles showed dramatic spikes in brightness (see above plots) • Spectra during these 5 spikes identifies them as auroral emissions • Bertaux et al. (2005b) and Leblanc et al. (2006) report on the brightest auroral event yet observed during (#3, Orbit 716) • The auroral emissions are observed for only 7-12 s • Auroral emitting regions are narrow • Given MEX velocity, the LOS chord through the emitting region (i.e. the N-S extent of the region) is only 23-40 km wide • Auroral emissions not always detected • Spatial distribution of aurora shown to the right • 5 white Xs mark locations of observed auroral emission • No other auroral emissions detected • Colors show radial component of magnetic field (Connerney et al., 2001) • Solid black lines running mostly N-S show SPICAM LOS during nadir observations • Lines curving from roughly N-S to E-W show position of MEX (dotted line) and Mars near point along the SPICAM LOS (solid line) during the orbit 716 grazing limb observation. • Auroral emissions occur in southern hemisphere over regions of strong crustal magnetic field • Emissions seen over regions of both positive and negative field polarity Pericenter SPICAM FOV Terminator MEX • The SPectroscopy for the Investigation of the Characteristics of Atmosphere of Mars (SPICAM) instrument onboard ESA’s Mars Express (MEX) consists of two spectrometers: an UV grating spectrometer and an acousto-optical tunable filter (AOTF) near-IR spectrometer. We focus on data from the UV spectrometer. Details of the instrument and its operating modes are given by Bertaux et al. (2006).Some characteristics of the SPICAM UV: • 2-part entrance slit • Wide (0.2° x 0.98°) • Narrow (0.02° x 1.9°) • Detector is a CCD coupled to an image intensifier • 288 detector rows along the 2.88° slit • 384 pixels along spectral dimension • Bandpass 108-317 nm with resolution =0.8 nm • Spectra read out every second • Bandwidth limited to 5 spatial elements • Typically, 32 detector rows binned together per spatial element The above table lists properties of the 5 detected auroral emissions. The local time, latitude, and longitude of the emitting region are given. The width of the emitting region is derived from the spacecraft velocity and the duration of auroral emissions, assuming an altitude of 130 km, the same as derived by Bertaux et al. (2005b) for the Orbit 716 aurora. Integrated brightness using rows 3 and 4 in the wide pare of the slit is given for the CO Cameron bands (a3-X1+) and CO2+ doublet (B2-X2). • Spectrum of the Aurora • The average spectrum from lines 0 and 1 (narrow part of slit) from orbit 716 shown to the left. • Spectra from other aurora detections are similar but much fainter/noisier. • Avg. spectrum from 10s before and 10s after spike (background) shows only Lyman-andnightglow emission from NO and d bands/ • Subtracting the average background spectrum from the average spectrum during the spike reveals aurora. • CO Cameron bands (a3-X1+) and CO2+ doublet (B2-X2) clearly detected. (Shown above right) • Marginally significant emissions from CO (A1-X1+) , C, and O. • Factor of 10 variation in brightness observed between the 5 events. Mars Express Orbit Apocenter altitude: 11,559 km Pericenter altitude: 259 km Period: 7.57 hr Inclination: 86º • SPICAM Observing Modes • SPICAM UV spectrometer has 4 operating modes • Stellar occultation • Solar occultation (via a side port and small pick-off mirror) • Nadir viewing • Limb observations • MEX pointing remains fixed in inertial space • Spacecraft orbital motion moves SPICAM LOS across the limb of Mars • The geometry of grazing limb observations is shown above • Data presented here use the nadir and grazing limb modes • Data taken for short period (of order 10 minutes) near periapse 60.17: Mars Express SPICAM Observations of the UV Nightglow and Auroral Emissions of Mars S.A. Stern (SwRI), A.J. Steffl (SwRI)†, J.-L. Bertaux, and F. Leblanc (Service d’Aeronomie, CNRS) †To whom correspondence should be addressed: steffl@boulder.swri.edu Abstract The SPICAM UV Spectrometer (UVS) aboard the ESA Mars Express (MEX) spacecraft is the first ultraviolet spectrometer to operate at Mars since the Mariner 9 UVS ceased operating in 1972. We present results of SPICAM observations of the night side of Mars obtained between 7 July 2004 and 15 January 2006. We find that Mars’s nightglow emission spectrum consists of the and bands of NO radiating between 190 and 270 nm and H I Lyman emission at 121.6 nm. Nightglow emissions peak between the 60-70 km above the surface. We also report four new detections of the Martian aurora over regions of high crustal magnetic field, bringing the total number of auroral detections to 5. The auroral spectrum contains primarily electron-excited emissions from CO and CO2+. SPICAM: MEX’s UV/IR Spectrometer Locations of Martian Aurora Martian Nightglow • Martian nightglow first reported by Bertaux et al. (2005a) • The nightglow spectrum, averaged over 15 limb-scanning orbits is shown above • Nightglow spectrum contains emissions from the Lyman and the NO C2-X2and A2+-X2 bands. • NO emission caused by the radiative association of N and O atoms • N and O atoms formed by dissociation of N2 and CO2 on dayside • Neutral N and O are transported to the night side where they form NO • NO emissions peak between 60-70 km altitude • The avg. spectrum from above 200 km (containing only Lyman has been scaled to the above data and subtracted to remove scattered light • NO emission intensity varies by a factor of 10 • The Spatial distribution of nightglow emissions is mapped out below • Nightglow emissions are detected on most limb-scanning orbits • Most prominent in southern (winter) hemisphere • Findings • Nightglow • The Martian nightglow shows emissions from NO and Lyman • NO emissions peak between 60-70 km • Nightglow intensity varies by a factor of 10 • Aurora • 5 instances of Martian aurora detected by SPICAM between 7-July-2004 and 14-Jan-2006 • Auroral emissions are sporadic • No emission detected on several orbits over high field regions • Auroral emitting regions are narrow • N-S width of regions range from 23-42 km • Auroral spectrum contains emission from CO Cameron bands (a3-X1+) and CO2+ doublet (B2-X2) • Factor of 10 in observed auroral brightness References Bertaux, J.-L., F. Leblanc, S. Perrier, E. Quémerais, O. Korablev, E. Dimarellis, A. Reberac, F. Forget, P.C. Simon, S.A. Stern, B. Sandel, and the SPICAM team (2005a) Nightglow in the upper atmosphere of Mars and implications for atmospheric transport, Science, 307, 566-569. Bertaux, J.-L., F. Leblanc, O. Witasse, E. Quémerais, J. Lilensten, S.A. Stern, B. Sandel, and O. Korablev (2005b) Discovery of aurora on Mars, Nature, 435, 790-794. Bertaux, J.-L., O. Korablev S. Perrier, E. Quémerais, F. Montmessin, F. Leblanc, S. Lebonnois, F. Forget, A. Fedorova, P. Rannou, E. Dimarellis, A. Reberac, D. Fonteyn, J.Y. Chaufray, S. Guibert, and the SPICAM team, (2006) SPICAM on Mars Express: Observing modes and overview of UV spectrometer data and scientific results, J. Geophys. Res., In Press. Connerney, J.E.P., M.H. Acuña, P.J. Wasilewski, G. Kletetschka, N.F. Ness, H. Rème, R.P. Lin, and D.L. Mitchell, (2001) The global magnetic field of Mars and implications for crustal evolution, Geophys. Res. Lett., 28, 4015-4018. Leblanc, F., O. Witasse, J. Winningham, D. Brain, J. Lilensten, P.-L. Blelly, R.A. Frahm, J.S. Halekas, and J.-L. Bertaux, (2006) Origins of the Martian aurora observed by Spectroscopy for Investigation of Characteristics of the Atmosphere of Mars (SPICAM) on board Mars Express, J. Geophys. Res., 111, A09313.


![【 AuroRa interactive】 [Aurora world]](https://cdn1.slideserve.com/2082289/slide1-dt.jpg)