Download
1 / 8
80 likes | 204 Views
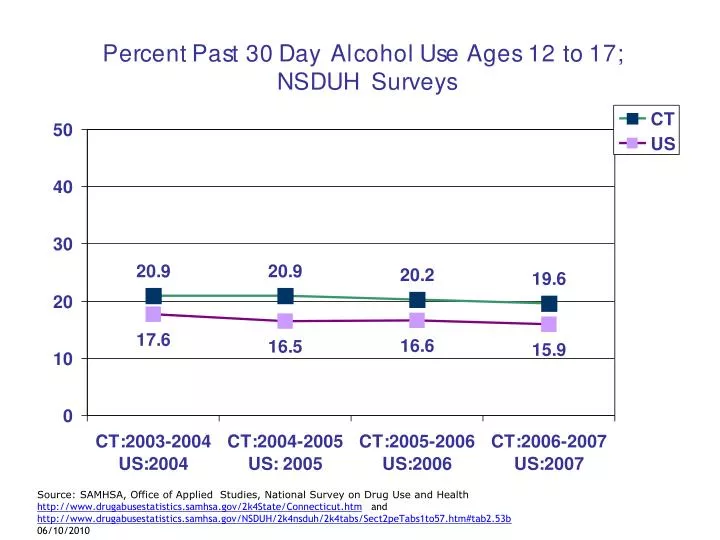
Source: SAMHSA, Office of Applied Studies, National Survey on Drug Use and Health http:// www.drugabusestatistics.samhsa.gov/2k4State/Connecticut.htm and http://www.drugabusestatistics.samhsa.gov/NSDUH/2k4nsduh/2k4tabs/Sect2peTabs1to57.htm#tab2.53b 06/10/2010.

E N D
Source: SAMHSA, Office of Applied Studies, National Survey on Drug Use and Health http://www.drugabusestatistics.samhsa.gov/2k4State/Connecticut.htm and http://www.drugabusestatistics.samhsa.gov/NSDUH/2k4nsduh/2k4tabs/Sect2peTabs1to57.htm#tab2.53b 06/10/2010
NOTE: Binge Alcohol Use is defined as drinking five or more drinks on the same occasion (i.e., at the same time or within a couple of hours of each other) on at least 1 day in the past 30 days. Source: SAMHSA, Office of Applied Studies, National Survey on Drug Use and Health http://www.drugabusestatistics.samhsa.gov/2k4State/Connecticut.htm and http://www.drugabusestatistics.samhsa.gov/NSDUH/2k4nsduh/2k4tabs/Sect2peTabs1to57.htm#tab2.53b 06/10/2010
Source: YRBSS Survey, http://apps.nccd.cdc.gov/yrbss/CompTableTwoLoc.asp?X=1&Loc1=CT&Loc2=XX&Year1=2007&Year2=2007 http://www.ct.gov/dph/cwp/view.asp?a=3132&q=388104
Source: YRBSS Survey, http://apps.nccd.cdc.gov/yrbss/CompTableTwoLoc.asp?X=1&Loc1=CT&Loc2=XX&Year1=2007&Year2=2007 http://www.ct.gov/dph/cwp/view.asp?a=3132&q=388104
Source: SAMHSA, Office of Applied Studies, National Survey on Drug Use and Health http://www.drugabusestatistics.samhsa.gov/2k4State/Connecticut.htm and http://www.drugabusestatistics.samhsa.gov/NSDUH/2k4nsduh/2k4tabs/Sect2peTabs1to57.htm#tab2.53b
Source: SAMHSA, Office of Applied Studies, National Survey on Drug Use and Health http://www.drugabusestatistics.samhsa.gov/2k4State/Connecticut.htm and http://www.drugabusestatistics.samhsa.gov/NSDUH/2k4nsduh/2k4tabs/Sect2peTabs1to57.htm#tab2.53b
Trends in Rate per 10,000 Population of Alcohol-Involved Motor Vehicle Accidents: Connecticut, 2002-2008 NOTE: 2008 findings are preliminary Source: Connecticut Department of Transportation Accident Data *“Property Damage Only” accidents which occurred on locally maintained roadways from January 1, 2007 to the present were included in the DOT accident file. “Property Damage Only” accidents which occurred on locally maintained roadways through December 31, 2006 were not coded for inclusion in the accident file.
Percent of Fatal Motor Vehicle Crashes Involving Alcohol: Connecticut vs. U.S., 1994-2007 Source: US DOT NHTSA, Fatality Analysis Reporting System (FARS)