Download
1 / 37
580 likes | 1.94k Views
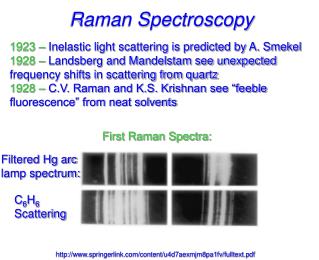
Raman Spectroscopy. Lecture Date: February 11 th , 2013. The History of Raman Spectroscopy. In 1928, C. V. Raman discovers that small changes occur the frequency of a small portion of the light scattered by molecules. The changes reflect the vibrational properties of the molecule.

E N D
Raman Spectroscopy Lecture Date: February 11th, 2013
The History of Raman Spectroscopy • In 1928, C. V. Raman discovers that small changes occur the frequency of a small portion of the light scattered by molecules. The changes reflect the vibrational properties of the molecule. • Raman was awarded the Nobel Prize in Physics in 1930 for his discovery. • In the 1970’s, lasers made Raman much more practical. Near-IR lasers (1990’s) allowed for avoidance of fluorescence in many samples. New continuous-wave (CW) and pulsed laser designs (2000’s) have allowed for advances in Raman microscopy and other modes of Raman spectroscopy (such as CARS and UV Raman). Sir Chandrasekhara Venkata Raman (www.nobelprize.org) C. V. Raman, K. S. Krishnan, Proc. Roy. Soc. London,1929,122, 23.
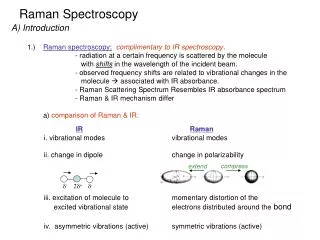
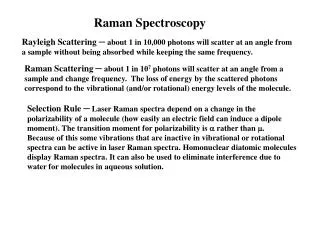
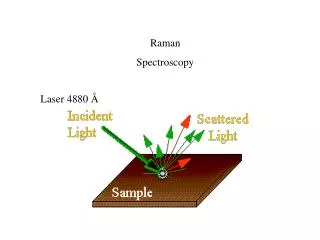
Rayleigh and Raman Scattering • Only objects whose dimensions are on the order of ~1-1.5 will scatter EM radiation (molecules). • Rayleigh scattering: • occurs when incident EM radiation induces an oscillating dipole in a molecule, which is re-radiated at the same frequency • Raman scattering: • occurs when monochromatic light is scattered by a molecule, and the scattered light has been weakly modulated by the characteristic frequencies of the molecule • Raman spectroscopy measures the difference between the wavelengths of the incident radiation and the scattered radiation.
The Raman Effect • Incident radiation excites “virtual states” (distorted or polarized states) that persist for the short timescale of the scattering process. • Polarization changes are necessary to form the virtual state and hence the Raman effect • This figure depicts “normal” (spontaneous) Raman effects Virtual state Virtual state hv1 – hv2 Anti-Stokes line hv1 hv1 – hv2 Stokes line hv1 Excited state (vibrational) Ground state (vibrational) Scattering timescale ~10-14 sec (fluorescence ~10-8 sec) H. A. Strobel and W. R. Heineman, Chemical Instrumentation: A Systematic Approach, 3rd Ed. Wiley: 1989.
More on Raman Processes • The Raman process: inelastic scattering of a photon when it is incident on the electrons in a molecule • When inelastically-scattered, the photon loses some of its energy to the molecule (Stokes process). It can then be experimentally detected as a lower-energy scattered photon • The photon can also gain energy from the molecule (anti-Stokes process) • Raman selection rules are based on the polarizability of the molecule • Polarizability: the “deformability” of a bond or a molecule in response to an applied electric field. Closely related to the concept of “hardness” in acid/base chemistry. P. W. Atkins and R. S. Friedman, Molecular Quantum Mechanics, 3rd Ed. Oxford: 1997.
If the incident radiation has frequency and the polarizability of the molecule changes between min and max at a frequency int as a result of this rotation/vibration: = max - min mean polarizability • Expanding this product yields: Anti-Stokes line Stokes line Rayleigh line More on Raman Processes • Consider the time variation of the dipole moment induced by incident radiation (an EM field): Induced dipole moment EM field polarizability P. W. Atkins and R. S. Friedman, Molecular Quantum Mechanics, 3rd Ed. Oxford: 1997.
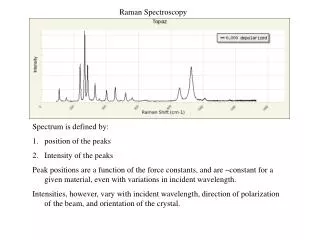
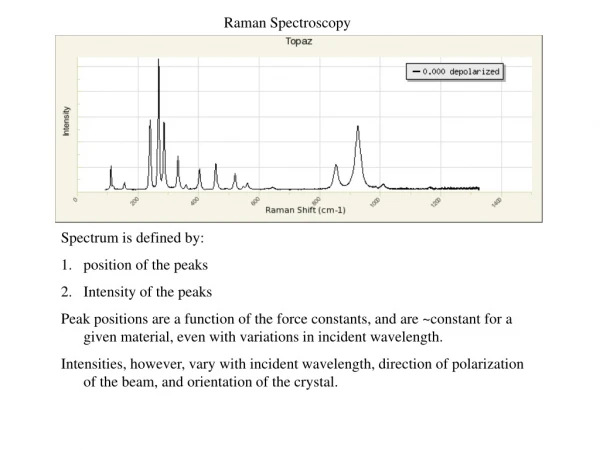
Rayleigh line (elastic scattering) 0 = 20492 cm-1 0 = 488.0 nm Stokes lines (inelastic scattering) Anti-Stokes lines (inelastic scattering) 459 314 218 -218 -314 -459 400 200 0 -200 -400 Raman shift cm-1 0 = (s - 0) The Raman Spectrum of CCl4 Observed in “typical” Raman experiments Figure is redrawn from D. P. Strommen and K. Nakamoto, Amer. Lab., 1981, 43 (10), 72.
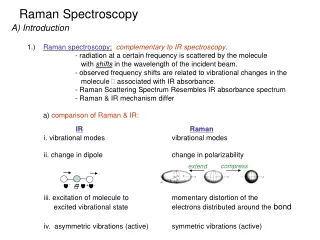
Raman-Active Vibrational Modes • Vibrational modes that are more polarizable are more Raman-active • Examples: • N2 (dinitrogen) symmetric stretch • cause no change in dipole (IR-inactive) • cause a change in the polarizability of the bond – as the bond gets longer it is more easily deformed (Raman-active) • CO2 asymmetric stretch • cause a change in dipole (IR-active) • Polarizability change of one C=O bond lengthening is cancelled by the shortening of the other – no net polarizability (Raman-inactive) • Some modes may be both IR and Raman-active, others may be one or the other!
The Raman Depolarization Ratio • Raman spectra are excited by linearly polarized radiation (laser). • The scattered radiation is polarized differently depending on the active vibration. • Using a polarizer to capture the two components leads to the depolarization ratio p: • The depolarization ratio p can be useful in interpreting the actual vibration responsible for a Raman signal.
Raman Spectrometers • The basic design dispersive Raman scattering system: Sample Wavelength Selector Detector InGaAs or Ge Radiation source (90° angle) • Special considerations: • Sources: lasers are generally the only source strong enough to scatter lots of light and lead to detectable Raman scattering • Lasers: He:Cd (441.6 nm), Ar ion (488.0 nm, 514.5 nm), He:Ne (632.8 nm), Diode (785 or 830 nm), Nd:YAG (1064 nm)
Inteferometers for FT-IR and FT-Raman • The Michelson interferometer, the product of a famous physics experiment: Figures from Wikipedia.org • Produces interference patterns from monochromatic and white light
A Typical FT-Raman System Horizontal stage for high-throughput, video controlled micro and macro-sampling The Thermo Nicolet 960 FT-Raman system
Raman Sources: Lasers • Lasers operate using the principle of stimulated emission • Stimulated emission is proportional to the number of atoms in the excited state (N2), the coefficient B21, and the energy density E of radiation with frequency 12 • Electronic population inversion is required to achieve gain via stimulated emission (before the fluorescence lifetime is reached) • Population inversion is achieved by “pumping” using lots of photons in a variety of laser gain media
Lasers: The Nd:YAG System • A typical laser system – the neodymium-doped yttrium aluminum garnet or Nd3+:Y3Al3O12 system (Nd:YAG) • YAG is a cubic crystalline material • Crystal field splitting causes electronic energy level splitting • 4F3/2 to 4I11/2 level emits laser radiation • The four-level system achieves population inversion more readily with less pumping
Lasers and Non-linear Optics • Non-linear optics (NLO): at high light intensities, media can behave such that their dielectric polarization is not linear in response to the electric field of the light • Second-harmonic generation (SHG): two photons are destroyed, and a single photon with twice the frequency is created • Example: a crystal potassium hydrogen phthalate (KHP) doubles 1064 nm laser radition (NIR) into 532 nm (green light)
Lasers in Raman Spectroscopy • Common lasers used in Raman spectroscopy, plus a few others of interest in chemistry (see Table 4.1 in Hooker and Webb): • Key laser performance parameters include the homogeneous and inhomogeneous linewidths, the Einstein coefficient (A21), the peak gain cross-section, the beam propagation factor (M2), …
Modern Raman Spectrometers • FT-Raman spectrometers – also make use of Michelson interferometers • Use IR (1 m) lasers, almost no problem with fluorescence for organic molecules • Have many of the same advantages of FT-IR over dispersive • But, there is much debate about the role of “shot noise” and whether signal averaging is really effective • CCD-Raman spectrometers – dispersive spectrometers that use a CCD detector (like the ICP-OES system described in the Optical Electronic lecture) • Raman is detected at optical frequencies! • Generally more sensitive, used for microscopy • Usually more susceptible to fluorescence, also more complex • Detectors - GaAs photomultiplier tubes, diode arrays, in addition to the above.
Basic Applications of Raman Spectroscopy • Raman can be used to study aqueous-phase samples • IR is normally obscured by H2O modes, these happen to be less intense in Raman • However, the water can absorb the scattered Raman light and will damp the spectrum, and lower its sensitivity • Raman has several problems: • Susceptible to fluorescence, choice of laser important • When used to analyze samples at temperatures greater than 250C, suffers from black-body radiation interference (so does IR) • When applied to darkly-colored samples (e.g. black), the Raman laser will heat the sample, can cause decomposition and/or more black-body radiation
Applications of Raman Spectroscopy • Biochemistry: water is not strongly detected in Raman experiments, so aqueous systems can be studied. Sensitive to e.g. protein conformation. • Inorganic chemistry: also often aqueous systems. Raman also can study lower wavenumbers without interferences. • Other unique examples: • Resonance Raman spectroscopy: strong enhancement (102 – 106 times) of Raman lines by using an excitation frequency close to an electronic transition (Can detect umol or nmol of analytes). • Surface-enhanced Raman (SERS): an enhancement obtained for samples adsorbed on colloidal metal particles. • Coherent anti-Stokes Raman (CARS): a non-linear technique using two lasers to observe third-order Raman scattering – used for studies of gaseous systems like flames since it avoids both fluorescence and luminescence issues.
Comparison of IR and Raman Spectroscopy • Advantages of Raman over IR: • Avoids many interferences from solvents, cells and sample preparation methods • Better selectivity, peaks tend to be narrow • Depolarization studies possible, enhanced effects in some cases • Can detect IR-inactive vibrational modes • Advantages of IR over Raman: • Raman can suffer from laser-induced fluorescence and degradation • Raman lines are weaker, the Rayleigh line is also present • Raman instruments can be more costly (especially lab systems) • Spectra are spread over many um in the IR but are compressed into several nm (20-50 nm) in the Raman • Final conclusion – they are complementary techniques!
IR and Raman Spectra of an Organic Compound The ATR FTIR and FT-Raman (1064 nm laser) spectra of flufenamic acid (an analgesic/anti-inflammatory drug):
IR and Raman Spectra of an Organic Compound The ATR FTIR and FT-Raman (1064 nm laser) spectra of flufenamic acid (an analgesic/anti-inflammatory drug): Note – materials usually limit IR in this region
IR and Raman Spectra of an Organic Compound The ATR FTIR (blue) and FT-Raman (red, 1064 nm laser) spectra of a crystalline polymorph of the drug tranilast:
Confocal Raman Microscopy Instrumentation • Combines a confocal microscope (discussed later in class) with a Raman spectrometer Am. Pharm. Rev., 13, 58-65 (2010).
Confocal Raman Microscopy Instrumentation • Multiple lasers and laser switching systems are common on confocal Raman microscope systems
Mapping a Drug Tablet with Confocal Raman Microscopy levoflaxacin microcrystalline cellulose Am. Pharm. Rev., 2010, 13, 58-65.
Mapping a Cross-sectioned Drug-coated Sphere Anal. Chem.2012,84, 4357-4372.
Mapping with Confocal Raman Microscopy Polymer (outer) Drug layer Sucrose core Anal. Chem.2012,84, 4357-4372.
Hand-held Raman Spectrometers • Handheld Raman instruments are useful for the identification of chemicals • Designed for safe for use in manufacturing plant environment, for military and chemical weapons applications, etc…
Hand-held Raman Spectrometers • Identification of diisopropylethylamine, a commercial chemical and synthetic reagent
UV and Resonance Raman Spectroscopy • UV lasers allow for better Raman performance, because of the 1/4 dependence of scattering, but fluorescence is a problem • With lasers in the 245-266 nm region, the Raman spectrum can be “fit” in the region above the laser but below the normal Stokes-shifted fluorescence spectrum
UV and Resonance Raman Spectroscopy • Resonance Raman scattering excites an electronic transition (e.g. using a UV laser in the 240-270 nm range) • Transitions can achieve 1000x increase in signal Raman Resonance Raman
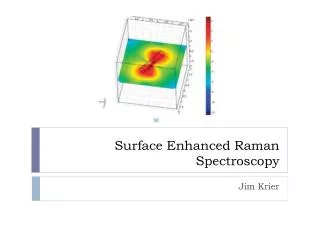
Surface Enhanced Raman Spectroscopy (SERS) • SERS is a form of Raman spectroscopy that involves a molecule adsorbed to the surface of a nanostructured metal surface which can support local surface plasmon resonance (LSPR) excitations • The Raman scattering intensity depends on the product of the polarizability of the molecule and the intensity of the incident beam; the LSPR amplifies the beam intensity when the beam is in resonance with plasmon energy levels – leads to signal enhancements of >106 • Single-molecule detection with SERS has been demonstrated R. A. Halverson, P. J. Vikesland, Environ. Sci. Technol. 2010, 44, 7749–7755, http://dx.doi.org/10.1021/es101228z
Coherent Anti-Stokes Raman Spectroscopy (CARS) • In CARS, the sample is excited by a probe beam with frequency pump, a Stokes beam (Stokes) and a probe beam (probe) • CARS uses tightly focused beams delivered via a microscope to achieve a phase matching condition necessary for the coherent process • Scanning a sample using a given vibrational resonance frequency can be used to determine the spatial distribution a Raman-active vibrational transitions at this frequency
CARS Applications • CARS is commonly used to perform rapid chemical imaging of biological materials for these components • DNA (phosphate stretching vibration) • Protein (amide I stretch) • Water (OH stretch) • Lipids (CH vibrations – stretching, bending, etc…) • Video-rate imaging of cells has been demonstrated C. L. Evans, X. S. Xie, Annu. Rev. Anal. Chem. 2008,1, 883- 909, http://dx.doi.org/10.1146/annurev.anchem.1.031207.112754
Raman Optical Activity (ROA) • ROA is a technique that employs circularly polarized radiation to study chiral molecules • ROA comes in two flavors, scattered circular polarization (SCP) and incident circular polarization (ICP) • Both right-angle and backscattered configurations are used • Main applications are to chiral analysis and molecular conformation (including biomolecules) L. D. Barron, A. D. Buckingham, Chem. Phys. Lett. 2010, 492, 199-213.
Further Reading Optional but recommended: J. Cazes, Ed. Ewing’s Analytical Instrumentation Handbook, 3rd Ed., Marcel Dekker, 2005, Chapter 7. Optional: http://www.spectroscopynow.com/raman/details/education/sepspec13199education/Introduction-to-Raman-Spectroscopy-from-HORIBA-Jobin-Yvon.html D. A. Skoog, F. J. Holler and S. R. Crouch, Principles of Instrumental Analysis, 6th Edition, Brooks-Cole, 2006, Chapter 18. D. A. Long, The Raman Effect, Wiley, 2002. S. Hooker, C. Webb, Laser Physics, Oxford, 2010. P. W. Atkins and R. S. Friedman, Molecular Quantum Mechanics, 3rd. Ed., Oxford, 1997. http://www.rp-photonics.com/yag_lasers.html