Download
1 / 34
360 likes | 583 Views
Supply Chain Management 2. Supply Chain Software. Supply Chain Execution Software. SCE software is intended to automate the different steps of the supply chain e.g. electronically routing orders from manufacturing plants to suppliers for the stuff to make your products.

E N D
Supply Chain Management 2 Supply Chain Software
Supply Chain Execution Software • SCE software is intended to automate the different steps of the supply chain e.g. electronically routing orders from manufacturing plants to suppliers for the stuff to make your products. • Ensures that the information flows smoothly between suppliers, customers and internally (e-procurement)
Supply Chain Planning (SCP) software • helps to evaluate the demand for goods and formulate plans to meet that demand. • Demand Planning Estimate demand • Inventory Optimisation Keep the right amount in stock • Schedule Manufacturing (depending on demand/goods in stock) • Order Management Validate and prioritise customer orders. • Transportation Planning • Purchasing management systems (supplier relationships)
Demand Planning • Determines how much product to make to satisfy different customers' demands. • Need access to previous sales data and external data. • Depends on accurate data to be effective • If a manufacturer knows what is actually selling in the shops rather than what wholesalers have ordered they are more likely to have good production planning. • Can use business intelligence tools to help forecast demand.
Transportation Planning • Decisions • Where to locate warehouses and transport hubs? • Which warehouse should supply which location/ • How often are shipments made? • What quantity should be shipped at a time? • What transport to use? • What kind of technology can they use to help?
How to do planning! • What if analysis! • Model changes in the supply chain and the effect of those changes. • Optimise shipments and manufacturing schedules.
Example : Apple Computers • Use SAP ERP system to monitor manufacturing sources in 3 continents. • System fully integrated with web-enabled front end. • Key benefit is to reply to demand more efficiently, inventory is reduced, cycle time is made as fast as possible. • Allows goods to move along the chain on an as-needed basis. • Can get forecasts from retailers and share with vendors. • Can share run-rate information – can speed up or slow down shipment depending on demand. • More accurate data from fully integrated system.
How does the software do this? • One program monitors 3 strands of the supply chain: • Product • the movement of goods from supplier to customer or any service needs. • Information • transmitting orders and updating delivery status • Finances • credit card payments, payment schedules, consignment and title ownership arrangements.
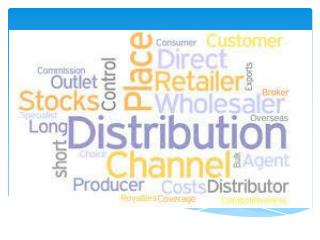
Supply Chain Collaboration • Data sharing between suppliers, manufacturers, and customers (extended enterprise) Internet-based supply chain integration e.g. Where one organisation's ERP suite communicates electronically with the corresponding systems (ERP and SCM) of suppliers, distributors and other business partners. • B2B links • Extranets • E-procurement
Collaboration Example: Wal-Mart and Procter & Gamble • The system hooks P&G up to Wal-Mart's distribution centers. • When P&G's products run low at the distribution centers, the system sends an automatic alert to P&G to ship more products. • In some cases P&G monitor the shelves of the stores. • P&G knows when to make, ship and display more products at the Wal-Mart stores. • No need to keep products piled up in warehouses. • Invoicing and payments happen automatically too. • The system saves P&G so much in time, reduced inventory and lower order-processing costs that it can afford to give Wal-Mart "low, everyday prices" without putting itself out of business.
Problems with Supply Chain Collaboration • Gaining trust from suppliers and partners. • Internal resistance to change. • Initial mistakes- system needs fine tuning e.g.
Different Supply Chain Models • Supply chain is also concerned with the flow of information and money. e.g. for a digital product there may be no movement of goods. • What if goods are returned? • What about re-cycling? • What about environmental impacts of products?
Green Supply Chain • covers all the phases of a product’s life cycle, from the extraction of raw materials through the design, production and distribution phases, to the use of products by consumers and their disposal at the end of the product’s life cycle (reconditioning, reuse, recycling). • involves all the players, including subcontractors, suppliers, distributors, buyers and consumers.
Cradle to Cradle • An alternative way of looking at the supply chain... • Think about what happens to a product at the end of its lifecycle and design it with this in mind.
Green Design • “Green design is an approach which seeks to improve a product's ecological quality, by reducing its negative impact on the environment throughout its life cycle. It involves taking account of the environment during a product's design or improvement phase.” “80% of the environmental impacts of a product are determined during the design phase.”
Case Study: Nike • Footwear production from roughly 50 factories in China, Vietnam, Indonesia, and Thailand. • Nike footwear, apparel and equipment sourced materials from nearly 700 factories, totaling 800,000 workers, located in 52 countries, creating a massive global supply chain with a carbon footprint of 1.36 million tons (MT) in FY06. • Currently, inbound logistics (factory to warehouse) accounted for 34% of Nike’s energy use and 25% of GHG emissions, and footwear manufacturing accounted for 54% and 59% of energy and GHG emissions. • [source: NIKE CONSIDERED: GETTING TRACTION ON SUSTAINABILITY Rebecca Henderson, Richard M. Locke, Christopher Lyddy, CateReavisissions, respectively]
Jones set the conceptual metric of “ROI2” as CR’s new strategic compass, emphasizing that business decisions included both financial and corporate responsibility returns. • If CR delivered ROI2, it was helping the business succeed and improve its social and environmental footprint.
Improving the supply chain-the Considered Group • in 2005, began to develop a holistic, predictive way to score products at different intervals throughout the development process. • However it was very difficult to create usable metrics for the product teams. • Considered Index was introduced in September 2007.
The goal for the Index was to create predictive metrics that would work uniformly across Nike’s varied footwear line. • This led to eliminating absolute measurements, like grams of waste per pair of shoes as an indicator, which proved to be a flawed metric. A men’s basketball shoe, for example, would almost always score worse than a kid’s shoe on absolute measures due to size disparity. Meanwhile, trying to compare the impact of each shoe while taking size differences into account was a slow and complicated process. • The tools team instead looked for intuitive proxies in the product process that were “85% right” and “pointed teams in the right direction.”
Scoring Model • The Index evaluated a product’s bill of materials (BOM), a roster of all materials specifications for a shoe’s components, using Nike’s Materials Assessment Tool, an abbreviated life cycle analysis for raw materials. • The Index scored environmentally preferred materials (EPMs) on multiple criteria including toxic hazard, energy and water usage, recycled content, recyclability, and other supply chain responsibility issues. • For example, organic cotton received a higher material score, while regular cotton scored lower. • The Index awarded points for each unique EPM in the shoe, and then divided the total points by the shoe’s number of unique materials. For example, a shoe garnering 5 EPM points with 10 unique materials would earn a .5 rating, but with 15 unique materials it would rate as .33
Example : setting scores • The Index evaluated solvent usage by scoring shoes on their least environmentally-friendly bonding option. • Mechanical bonds ranked first, followed by water-based cement bonds, then solvent-based cement bonds. Cemented bonds were further evaluated on whether they used water or solvents to wash, prime, and cement. Bonds using solvent washes scored better than ones with solvent washes and priming; • all-solvent chemistry was penalized.
The waste score was determined primarily by the midsole construction process and pattern efficiency. The scores for these areas were weighted according to their known contribution to Nike’s waste stream. For example, pattern efficiency was 60% of the total score, since production processes related to cutting upper materials accounted for approximately 60% of the footwear waste stream. • The Index graded standard process options on footprint impacts, and awarded points to increasingly efficient patterns. Shoes with single material sockliners or without sockliners - the foam pads sitting directly underneath the foot – and those that reduced or reused tooling earned points, while points were docked for wasteful ultrasonic welding and autoclaving, an energy- and solvent-intensive process. • However, there were a number of metrics that were not incorporated into the Index. For example, the team could not identify suitable predictive metrics for outsole construction, and dropped formal assessment of the energy footprint of midsole construction pending completion of ongoing energy mapping studies.
A product’s overall rating was determined by calculating combined scores for materials, solvents, and waste – maximum scores in each category carried roughly the same weight – and adding innovation points.
Green sourcing • embraces everything sourced from suppliers, subcontractors, service providers and so on, which incorporates environmental criteria. • “procurement" function need criteria for green purchasing • Purchasing Criteria: acquisition cost, costs generated throughout the product's life cycle-cost of use, maintenance, end-of-life processing (recovery, recycling etc) - total cost of ownership (TCO) metric comprises all the costs of a product generated over the full length of its life cycle.
Upstream Supply Chain • Defining material/product requirements • identifying suppliers. • Supplier involvement in a green sourcing initiative can take the form of jointly developing and designing new products.
Green manufacturing Lessening environmental impact • For the purposes of green manufacturing, lessening environmental impact per se involves two different approaches: Better consumption: reducing • harmful emissions, the consumption of toxic products and the production of waste (concept: less polluting production). Lower consumption: reducing • consumption of energy and raw materials, reducing waste consumables
Reduce consumption of energy and raw materials • Use less polluting materials • Use an Environmental Management System
Downstream supply chain: logistics 1. Optimise transport flows • pooling logistics • optimise and rationalise the various transport flows (truck load factors and so on). • Pooling of circuits, vehicles and infrastructures (e.g. warehouses). • Reducing the total number of warehouses along the logistics chain • Reducing traffic volumes (number of journeys, distances covered, etc.) • Reducing delivery times • Reducing the cost of journeys.
2. Use of less polluting modes of transport • Shipping • Rail • Combined transport (rail-road, sea-road, waterway-road) • Waterway. 3. Reverse Logistics Deal with recycling, reuse – end of life issues
Returns management • commercial returns (leasing, mail order, B2C), • contractual returns (newspapers, publishers), • Returns under warranty (faulty goods), • production waste and scraps • “functional” returns, such as packaging to be reused for the same purpose (containers, packaging). • WEEE