Download
1 / 1
10 likes | 116 Views
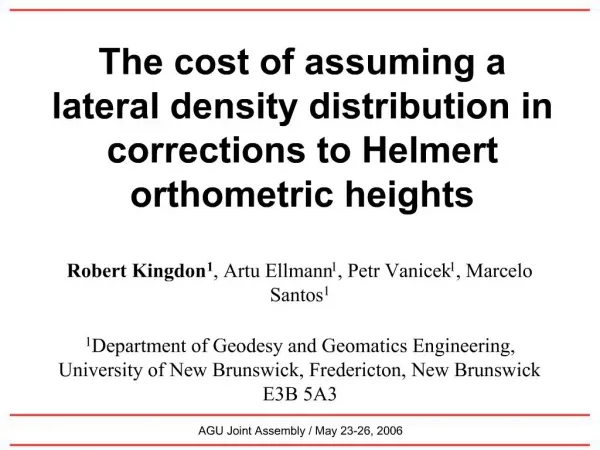
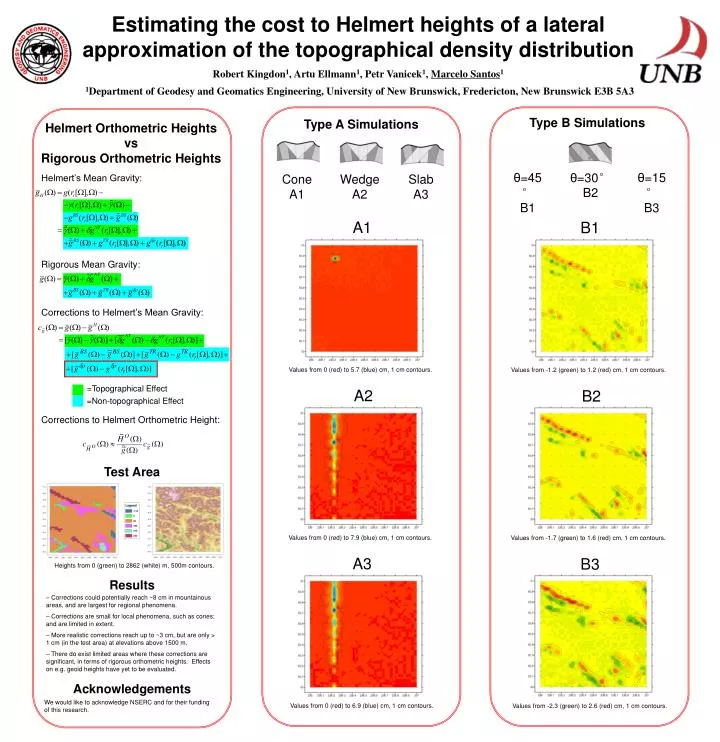
Robert Kingdon 1 , Artu Ellmann 1 , Petr Vanicek 1 , Marcelo Santos 1. 1 Department of Geodesy and Geomatics Engineering, University of New Brunswick, Fredericton, New Brunswick E3B 5A3. Type B Simulations. Type A Simulations. Helmert Orthometric Heights vs Rigorous Orthometric Heights.

E N D
Robert Kingdon1, Artu Ellmann1, Petr Vanicek1, Marcelo Santos1 1Department of Geodesy and Geomatics Engineering, University of New Brunswick, Fredericton, New Brunswick E3B 5A3 Type B Simulations Type A Simulations Helmert Orthometric Heights vs Rigorous Orthometric Heights Estimating the cost to Helmert heights of a lateral approximation of the topographical density distribution θ=45° B1 θ=30° B2 θ=15° B3 Cone A1 Wedge A2 Slab A3 Helmert’s Mean Gravity: A1 B1 Rigorous Mean Gravity: Corrections to Helmert’s Mean Gravity: Values from 0 (red) to 5.7 (blue) cm, 1 cm contours. Values from -1.2 (green) to 1.2 (red) cm, 1 cm contours. =Topographical Effect A2 B2 =Non-topographical Effect Corrections to Helmert Orthometric Height: Test Area Values from 0 (red) to 7.9 (blue) cm, 1 cm contours. Values from -1.7 (green) to 1.6 (red) cm, 1 cm contours. A3 B3 Heights from 0 (green) to 2862 (white) m, 500m contours. Results – Corrections could potentially reach ~8 cm in mountainous areas, and are largest for regional phenomena. – Corrections are small for local phenomena, such as cones; and are limited in extent. – More realistic corrections reach up to ~3 cm, but are only > 1 cm (in the test area) at elevations above 1500 m. – There do exist limited areas where these corrections are significant, in terms of rigorous orthometric heights. Effects on e.g. geoid heights have yet to be evaluated. Acknowledgements We would like to acknowledge NSERC and for their funding of this research. Values from 0 (red) to 6.9 (blue) cm, 1 cm contours. Values from -2.3 (green) to 2.6 (red) cm, 1 cm contours.