Download
1 / 27
270 likes | 399 Views
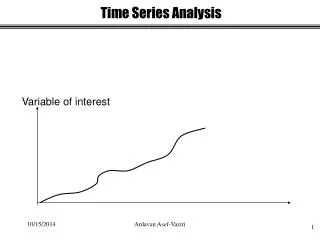
Composition as a Variable (Two Component System). The free energy concept may be used to analyze the influence of composition on phase constitution. Two components system will be considered initially .

E N D
The free energy concept may be used to analyze the influence of composition on phase constitution. • Two components system will be considered initially. • The mixing of two miscible components within a single, homogenous solution is a irreversible process. • Complete unmixing is impossible.
Entropy • Mixing always increases the entropy, • Such increase would be largest near 50-50 composition as sown in fig 2.4. • The dashed line in fig. 2.4 (a): represents the entropy of two components, • At all compositions, before mixing. The entropy of mixing is represented in fig. 2.4 (b).
Such an increase in the entropy or decrease in free energy signifies a tendency on the part of two components to mix. • The increase in the entropy due to mixing is then simply the difference between the ordinates of the total entropy curve in fig. 2.4 c and the dashed line.
This quantity, the entropy of mixing , designated by the symbol S is represented in Fig.2.4 b. • Such an increase or decrease in free energy, signifies a tendency on the part of the two components to mix.
Enthalpy • The other contribution to the free energy, the enthalpy. • In solid volume changes are relatively small; • Therefore enthalpy may be approximated by the internal energy (E). • A qualitative analysis of the enthalpy of mixing may then be desired by bonding energy considerations.
(a) –ve deviation from ideality • E.g. if a atoms prefer to be in the vicinity of B atoms rather than A atoms, • And similarly B atoms behave in a like manner • The energy ( or enthalpy) will be lowered by mixing. • This is true because bond energy is negative for stable bonds.
With the stronger bonds more strongly negative. • Consequently in fig. 2.5 • Where the dashed lines are the total enthalpy before mixing • The enthalpy lies below the dashed line at all compositions after mixing.
The maximum enthalpy decrease is expected to lie near the 50-50 compositions, • Because a maximum number of A-B bonds would be formed there, • If the mixture is truly homogenous; • This situation is depicted in fig. 2.5 a and referred to as a –ve deviation from ideality.
Ideal Case is diagram 2.5 b. • Ideal Case is diagram 2.5 b. • Here bonding strength is equal for A-A, B-A, & A-B composition • And no enthalpy change occurs on mixing.
positive deviation • A positive deviation in figure 2.5 c • If A and B prefer the company of their own kind • The average bond energy after mixing is less negative • And therefore enthalpy is raised by mixing.
These considerations are over simplified • Because lattice strains due to atomic size difference have not been considered. • The actual energies of such solutions are more complicated than only atomic bonding. • And many solid solutions are not completely homogenous at equilibrium. • Fig. 2.5 is nevertheless, qualitatively correct in almost all cases.
Free Energy of a typical solution: • To obtain the free energy of a typical solution • Multiply the ordinates of fig. 2.4 c by T and subtracting this quantity from enthalpy. • Fig. 2.6 a,b,c cover the three cases described in fig. 2.5
–ve deviation and ideal solutions • –ve deviation and ideal solutions. • The mixing decrease the free energy and can be concluded that such solutions are stable.
+ve deviation: • At higher T, the entropy term dominates the free energy change on mixing • And solutions would be always stable. • At lower T, (fig. 2.6 c) the positive contributions from the enthalpy shows up. • The free energy of mixing for the solutions with intermediate composition (near the middle of fig 2.6 c) may be positive, • Signifying that such solutions are unstable.
To find the stable arrangements for these compositions • we need only look for the situation which yields the lowest possible total free energy. • Fig. 2.7 shows what we are looking for. • The unstable solution of composition X3 splits up into a mixture of two solutions of compositions X1 and X2 respectively.
Free energy diagram for a binary alloy, showing two terminal solid solution • Figure 2.7 • Free energy diagram for a binary alloy, showing separation into two terminal solid solution. • The unstable solution of composition X3 splits up into a mixture of two solutions of compositions X1 and X2 respectively. • The free energy of the mixture lies on the dashed line for all compositions between X1 and X2 .
Since the free energy of the mixture is less than that of the single solution over this entire composition range • Therefore, it can be concluded that for all total compositions between X1 and X2 • A mixture of two solutions of these two compositions is the most stable state. • Note that this is so even for composition where the free energy of mixing is negative
Procedure for finding stable phase equilibrium in binary system where number of alternative phases is formed • Figure 2.25 a • It can be seen that Ua (Chemical Potential) at concentration X=Xa is equal to the intercept at 100 % A of the tangent to the free energy curve at that point. • The graphical construction is given at Fig. 2.25a. • Thus the slope of the energy curve (dG/dx) determines the magnitude of the chemical potential.
If two phases’ alpha and beta are present in equilibrium, • The equilibrium condition demands that • The chemical potential of the component A is identical in the two phases, • Same isthat of component B in the two phases. • This condition is only satisfied by two phases and • Therefore the composition of the two phases in equilibrium is given by the point of tangency of the line of the two curves.
It also follows from this construction that • Microstructure of any alloy b/t the composition X-alpha and X-beta : • Will consist of the equilibrium phases alpha and beta in the appropriate ratio, • To yield the average alloy composition. • Free energy curves to construct phase diagram indicates that • The stable phase or phase mixture at any temperature is that which has lowest free energy.
Thus once the form of free energy curve is established as a function of T • The lower envelop of the free energy curve or the common tangent b/t them defines the phases present at any T. • This is shown in fig2.26 defines the phases present • Or the situation where two solid phases and a liquid phase are present isothermally across an equilibrium diagram.
How the phase relationship change with temperature as the free energy curve displaced relative to each other , • The equilibrium diagram can be constructed. • Several examples are given blow.
Procedure for finding stable phase equilibrium in binary system where number of alternative phases is formed • The stable states for all compositions are described by the lowest possible envelop of the free energy curves and tangent lines fig. 2.8. • In fig 2.8 gamma and liquid are unstable at all compositions • And alpha is stable for A-rich mixture and beta is stable for B-rich mixture.
At all compositions between the point o tangency with the dashed line, mixture of alpha and beta are stable. • The alpha and beta always have compositions corresponding to the point of tangency. • Of course situation changes with changing temperature. • If the temperature is high enough, • The free energy composition curves for the liquid will lie below all other curves and tangent lines.
Signifying that the stability of the liquid phase at all composition • If the relative positions of the free energy compositions curves for a binary system is known for a series of the temperature. • The stable phases or mixture of phases may be deduced immediately for each temperature.
These data may then be plotted in temperature-composition space. • This result in the familiar phase diagram which map out the region of the stability for each phase and phase mixture.