Download
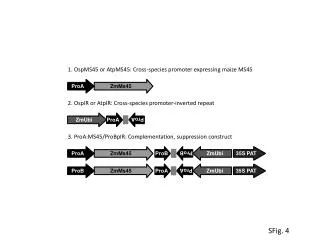
1 / 9
90 likes | 220 Views
Xba I. Xba I. A. 35S P. tAPX or GUS. intron. NOS T. tAPX or GUS. pGWB80/tAPX (or GUS). Xba I. Spe I. B. G 10-90 P. XVE. T3A. Lex A P. ccdB. T3A. pMDC7. C. G 10-90 P. XVE. T3A. Lex A P. T3A. tAPX or GUS. intron. tAPX or GUS. pMDC7/tAPX (or GUS) RNAi.

E N D
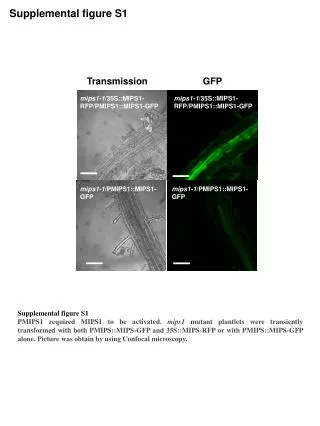
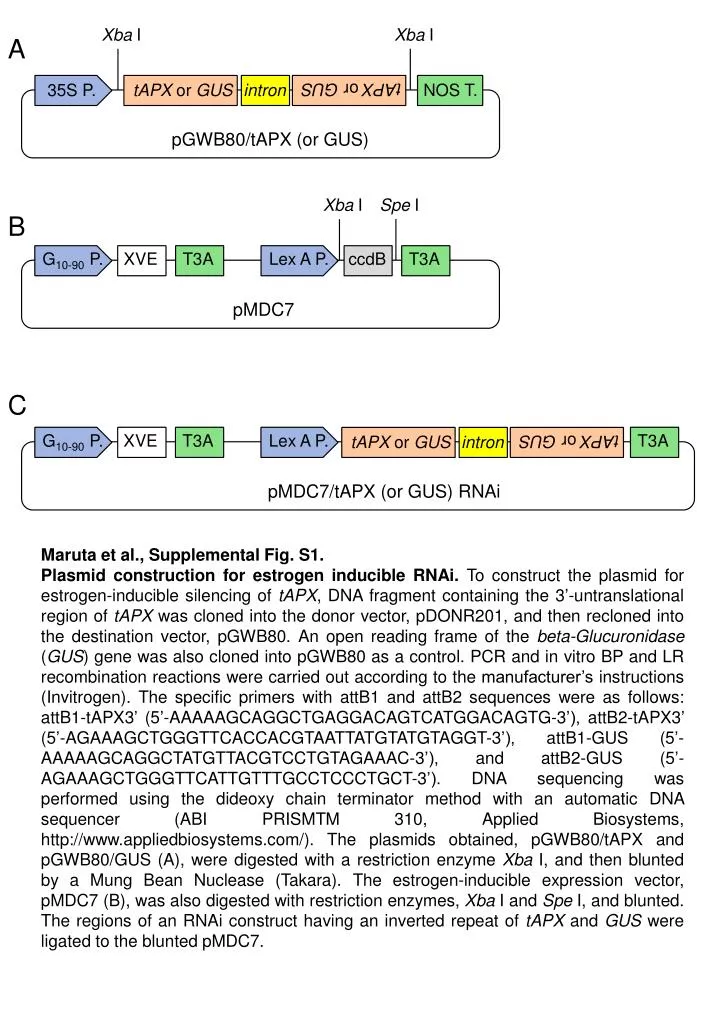
Xba I Xba I A 35S P. tAPX or GUS intron NOS T. tAPX or GUS pGWB80/tAPX (or GUS) Xba I Spe I B G10-90 P. XVE T3A Lex A P. ccdB T3A pMDC7 C G10-90 P. XVE T3A Lex A P. T3A tAPX or GUS intron tAPX or GUS pMDC7/tAPX (or GUS) RNAi Maruta et al., Supplemental Fig. S1. Plasmid construction for estrogen inducible RNAi. To construct the plasmid for estrogen-inducible silencing of tAPX, DNA fragment containing the 3’-untranslational region of tAPX was cloned into the donor vector, pDONR201, and then recloned into the destination vector, pGWB80. An open reading frame of the beta-Glucuronidase (GUS) gene was also cloned into pGWB80 as a control. PCR and in vitro BP and LR recombination reactions were carried out according to the manufacturer’s instructions (Invitrogen). The specific primers with attB1 and attB2 sequences were as follows: attB1-tAPX3’ (5’-AAAAAGCAGGCTGAGGACAGTCATGGACAGTG-3’), attB2-tAPX3’ (5’-AGAAAGCTGGGTTCACCACGTAATTATGTATGTAGGT-3’), attB1-GUS (5’-AAAAAGCAGGCTATGTTACGTCCTGTAGAAAC-3’), and attB2-GUS (5’-AGAAAGCTGGGTTCATTGTTTGCCTCCCTGCT-3’). DNA sequencing was performed using the dideoxy chain terminator method with an automatic DNA sequencer (ABI PRISMTM 310, Applied Biosystems, http://www.appliedbiosystems.com/). The plasmids obtained, pGWB80/tAPX and pGWB80/GUS (A), were digested with a restriction enzyme Xba I, and then blunted by a Mung Bean Nuclease (Takara). The estrogen-inducible expression vector, pMDC7 (B), was also digested with restriction enzymes, Xba I and Spe I, and blunted. The regions of an RNAi construct having an inverted repeat of tAPX and GUS were ligated to the blunted pMDC7.
A B IS-tAPX-19 IS-tAPX-19 IS-tAPX-2 IS-tAPX-2 IS-GUS-2 IS-GUS-2 wild type wild type XVE tAPX RNAi- trigger tAPX Actin8 Actin8 C 0 12 16 20 24 (h) tAPX RNAi- trigger Actin8 Maruta et al., Supplemental Fig. S2. Association between expression of tAPX and dsRNA in the IS-tAPX-19 plants during treatment with estrogen. (A) IS-GUS-2, IS-tAPX-2, and IS-tAPX-19 plants (T2 generation) were grown under normal light for 17 days. The transcript levels of tAPX and XVE were determined by sem-quantitative RT-PCR. (B) Seventeen-day-old IS-GUS-2, IS-tAPX-2, and IS-tAPX-19 plants were sprayed with a 100 µM estrogen. At 24 h after the estrogen treatment, the expression of tAPX and RNAi-triggers was determined by semi-quantitative RT-PCR. The expression of RNAi-triggers was indicated using a primer set for the intron region of RNAi-triggers (Supplemental Fig. S1C). Primer sequences were as follows; intron-F (5’-GGTGAGATCTTACTTCTCCT-3’), intron-R (5’-CGAAACTATTTCGCCGAATC-3’). (C) Seventeen-day-old IS-tAPX-19 plants were sprayed with a 100 µM estrogen. A time-course analysis of the expression of tAPX and RNAi-triggers was performed.
AtbZIP65 hydrolase 5 15 * * 4 10 3 2 5 * 1 * Relative mRNA level Relative mRNA level 0 0 ACS7 PDIL1-1 7 3 * * 6 5 2 4 3 * 1 2 * 1 Relative mRNA level Relative mRNA level 0 0 UP ANAC074 10 3 * * 8 2 6 4 * 1 2 * Relative mRNA level Relative mRNA level 0 0 F-box 3 * 2 IS-GUS-2-17 Relative mRNA level IS-tAPX-19-23 1 * wild type 0 KO-tAPX Maruta et al., Supplemental Fig. S3. The transcript levels of RTS genes in the estrogen-treated IS-tAPX-19-23 or the KO-tAPX plants. (A) Seventeen-day-old IS-GUS-2-17 and IS-tAPX-19-23 plants were sprayed with a 100 µM estrogen, and kept under normal light. At 48 h after the estrogen treatment, the transcript levels of RTS genes (AtbZIP65, ACS7, UP, F-box, hydrolase, PDIL1-1, and ANAC074) were measured by q-PCR. Error bars indicate SD (n = 3). Significant differences: *P < 0.05 vs. the value for IS-GUS-2-17 plants. (B) The transcript levels of RTS genes in 17-day-old wild-type and KO-tAPX plants were measured by q-PCR. Error bars indicate SD (n = 3). Significant differences: *P < 0.05 vs. the value for wild-type plants.
At3g08970 At2g29490 At2g29470 At2g29460 At1g17170 At2g43510 At1g10585 At3g53230 6 4 Relative mRNA level 2 0 At4g37370 At3g49620 At4g37990 At2g41380 At4g22530 At3g54150 At1g26420 At1g26380 6 4 Relative mRNA level 2 0 At3g26830 At3g28210 At1g57630 At4g01870 At3g11340 At2g43820 At1g22400 At1g19020 6 4 Relative mRNA level 2 0 At1g05340 At2g21640 At3g09350 At1g13340 At4g39670 At1g62300 At5g13080 At2g32190 6 4 Relative mRNA level 2 0 IS-GUS-2-17 IS-tAPX-19-23 Maruta et al., Supplemental Fig. S4. The transcript levels of general oxidative stress response markers in the estrogen-treated IS-tAPX-19-23 plants. Seventeen-day-old IS-GUS-2-17 and IS-tAPX-19-23 plants were sprayed with a 100 µM estrogen, and kept under normal light. At 48 h after the estrogen treatment, the transcript levels of “general oxidative stress response markers” were measured by q-PCR. Error bars indicate SD (n = 3).
IS-tAPX-19-23 IS-GUS-2-17 Mock Estrogen Treatment Maruta et al., Supplemental Fig. S5. Effect of lack of tAPX on cold acclimation under LL. Seventeen-day-old IS-GUS-2-17 and IS-tAPX-19-23 plants were sprayed with a 100 µM estrogen solution or water (mock), and transferred to cold stress conditions (10 µmol photons m-2 s-1, 4°C) for 2 weeks. The treatment with estrogen was performed every 3 days in order to maintain the tAPX silencing. At 14 days after cold stress, the IS-GUS-2-17 and IS-tAPX-19-23 plants were photographed. The same results were obtained in three independent experiments.
A CBF1/ DREB1B CBF2 DREB1C COR414- TM1 COR414- TM2 COR6.6 COR15B 1.5 1.0 * * Relative mRNA level 0.5 0 wild type KO-tAPX B B C 0.6 wild type KO-tAPX 0.4 Fv/Fm 0.2 0 Maruta et al., Supplemental Fig. S6. Effect of lack of tAPX on cold acclimation. (A) The wild-type and KO-tAPX plants were grown under light for 17 days. The transcript levels of RTS genes (CBF1/DREB1B, CBF2/DREB1C, COR6.6, COR15B, COR414-TM1,and COR414-TM2) were measured by q-PCR. Error bars indicate SD (n = 3). Significant differences: *P < 0.05 vs. the value for wild-type plants. (B) Seventeen-day-old wild-type and KO-tAPX plants were transferred to cold stress conditions (100 µmol photons m-2 s-1, 4°C). At 2 weeks after cold stress, the wild-type and KO-tAPX plants were photographed. (C) Fv/Fm values in the leaves of wild-type and KO-tAPX at 2 weeks after cold stress were measured using a Closed FluorCam 800MF. Error bars indicate SD (n = 3).
TIR domain protein TolB-related protein ICS2 RLP7 RLP23 RLP34 1.5 1.5 1.0 1.0 Relative mRNA level Relative mRNA level 0.5 0.5 * * * * * 0 0 RLP39 RLP41 NIMIN-3 AtNUDX6 LCR68 LCR70 * * * * * wild type KO-tAPX Maruta et al., Supplemental Fig. S7. Effect of lack of tAPX on the transcript levels of RTS genes involved in disease resistance. The wild-type and KO-tAPX plants were grown under normal light for 17 days. The transcript levels of RTS genes (ICS2, TolB, TIR, RLP7, RLP23, RLP34, RLP39, RLP41, NIMIN3, NUDX6, LCR68, and LCR70) were measured by q-PCR. Error bars indicate SD (n = 3). Significant differences: *P < 0.05 vs. the value for wild-type plants.
1.0 4 wild type 0.8 KO-tAPX 3 0.6 2 Free SA (µg g-1 FW) Total SA (µg g-1 FW) 0.4 1 0.2 0 0 Maruta et al., Supplemental Fig. S8. Effect of lack of tAPX on the levels of SA. The wild-type and KO-tAPX plants were grown under normal light for 17 days. The levels of free and total SA in the wild-type and KO-tAPX plants were measured as described under ‘‘Experimental Procedures.’’
A IS-tAPX-19-23 IS-GUS-2-17 1.0 0.8 Mock 0.6 Fv/Fm 0.4 IS-GUS-2-17 Estrogen Treatment 0.2 IS-tAPX-19-23 0 0 24 48 72 (h) Maruta et al., Supplemental Fig. S9. Effect of tAPX silencing on HL sensitivity. Seventeen-day-old IS-GUS-2-17 and IS-tAPX-19-23 plants were sprayed with a 100 µM estrogen solution or water (mock), and kept under NL. At 48 h after the treatments, IS-GUS-2-17 and IS-tAPX-19-23 plants were exposed to HL (1000 µmol photons m-2 s-1).(A) At 72 h after HL, the IS-GUS-2-17 and IS-tAPX-19-23 plants were photographed. The same results were obtained in three independent experiments. (B) Fv/Fm values in the leaves of IS-GUS-2-17 and IS-tAPX-19-23 were measured using a Closed FluorCam 800MF. Error bars indicate SD (n = 5).