Download
1 / 38
380 likes | 396 Views
Dive into the art of creating aesthetically pleasing and functional dashboards for web pages or mobile apps using R programming and shinydashboard. Learn key design steps, tips, and the basics of Shiny app development, including headers, sidebars, and bodies. Enhance your skills by adding boxes, rows, and columns, and discover how to create a well-structured, interactive dashboard that communicates data effectively.

E N D
Dashboards I think, aesthetically, car design is so interesting - the dashboards, the steering wheels, and the beauty of the mechanics. I don't know how any of it works, I don't want to know, but it's inspirational. Paloma Picasso
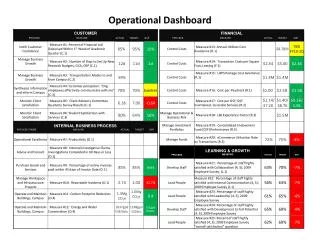
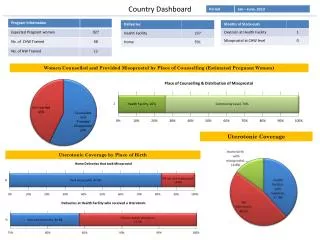
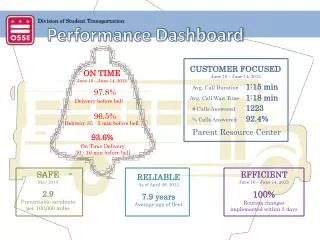
Dashboard • Easy to comprehend • Web page or mobile device app screen • Current status • Historical trends • Key performance indicators • Mainly graphical
Design steps • What’s the key data to communicate? • Key performance indicator (KPI) • Critical success factor (CSF) • … • Establish a high quality data source • Visualize the data • Add text to improve comprehension
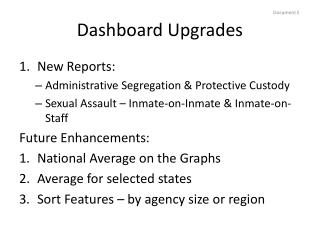
Design tips • Design for ease of navigation and retrieval • Simplicity is preferred to complexity • Use colors consistently to alert and notify • Match typically use (e.g., a red icon for an alert) • Use interactivity to enable the client to customize as required • Imitate dashboards, or their features, that work well • Prototype, release, learn, and redesign
Dashboards with R • Integrated development environment (IDE) • Rstudio • Packages • shiny • shinydashboard • Documentation
The basics • Header • Sidebar • Body • library(shiny) • library(shinydashboard) • header <- dashboardHeader() • sidebar <- dashboardSidebar() • body <- dashboardBody() • ui <- dashboardPage(header,sidebar,body) • server <- function(input, output) {} • shinyApp(ui, server)
The basics • Alternative format • Harder to debug because parentheses abound • library(shiny) • library(shinydashboard) • ui <- dashboardPage( • dashboardHeader(), • dashboardSidebar(), • dashboardBody() • ) • server <- function(input, output) {} • shinyApp(ui, server)
When you create a dashboard it remains running until terminated • Click stop on the console’s top left to terminate
Shiny App • A dashboard is a Shiny app • UI • User-interface script • Determines layout and appearance • Server • Server script • Commands for running the app
A header and a body • library(shiny) • library(shinydashboard) • library(quantmod) • header <- dashboardHeader(title = 'Apple stock watch') • sidebar <- dashboardSidebar() • body <- dashboardBody(paste('Latest price ',getQuote('AAPL')$Last)) • ui <- dashboardPage(header,sidebar,body) • server <- function(input, output) {} • shinyApp(ui, server) • The quantmod package supports the development, testing, and deployment of statistically based trading models <http://www.quantmod.com>
Header and body • dashboardHeader(..., title =NULL, titleWidth =NULL, • disable =FALSE, .list=NULL) • … means items • dashboardBody(...)
Boxes and rows • Boxes are the building blocks of a dashboard • box() • A row contains one or more boxes • fluidRow()
Boxes • library(shiny) • library(shinydashboard) • library(quantmod) • header <- dashboardHeader(title = 'Apple stock watch') • sidebar <- dashboardSidebar() • boxLatest <- box(title = 'Latest price: ',getQuote('AAPL')$Last, background = 'blue' ) • boxChange <- box(title = 'Change ',getQuote('AAPL')$Change, background = 'red' ) • row <- fluidRow(boxLatest,boxChange) • body <- dashboardBody(row) • ui <- dashboardPage(header,sidebar,body) • server <- function(input, output) {} • shinyApp(ui, server)
Box • box(..., title =NULL, footer =NULL, status =NULL, • solidHeader =FALSE, background =NULL, width =6, height =NULL, • collapsible =FALSE, collapsed =FALSE) • fluidRow(...)
Skill builder • Add three more boxes to the dashboard
Layout • Row-based layout • Rows have a grid width of 12 • A box with width=6 (the default) takes up half of the width • The tops of the boxes in each row will be aligned, but the bottoms may not be • Rows ensure elements appear on the same line (if the browser has adequate width)
Layout • Column-based layout • Create columns and then place boxes within those columns • Columns define how much horizontal space, within a 12-unit width grid, each element should occupy
Multicolumn layout • library(shiny) • library(shinydashboard) • library(quantmod) • header <- dashboardHeader(title = 'Apple stock watch') • sidebar <- dashboardSidebar() • boxLast <- box(title = 'Latest', width=NULL, getQuote('AAPL')$Last, background='navy') • boxHigh <- box(title = 'High', width=NULL, getQuote('AAPL')$High , background='light-blue') • boxVolume <- box(title = 'Volume', width=NULL, formatC(getQuote('AAPL')$Volume,big.mark=','), background='aqua') • boxChange <- box(title = 'Change', width=NULL, getQuote('AAPL')$Change, background='light-blue') • boxLow <- box(title = 'Low', width=NULL, getQuote('AAPL')$Low, background='light-blue') • col1 <- column(width = 4,boxLast,boxHigh,boxVolume) • col2 <- column(width = 4,boxChange,boxLow) • rows <- fluidRow(col1,col2) • body <- dashboardBody(rows) • ui <- dashboardPage(header,sidebar,body) • server <- function(input, output) {} • shinyApp(ui, server) • Note: Formatting of volume with formatC()
Sidebar • A sidebar is typically used for quick navigation • It can contain menu items • Click on a link or icon to display different content in the body of the dashboard • See Font-Awesome and Glyphicons for available icons
Sidebar • library(shiny) • library(shinydashboard) • library(quantmod) • header <- dashboardHeader(title = 'Stock watch') • menuApple <- menuItem("Apple", tabName = "Apple", icon = icon("dashboard")) • menuGoogle <- menuItem("Google", tabName = "Google", icon = icon("dashboard")) • sidebar <- dashboardSidebar(sidebarMenu(menuApple, menuGoogle)) • tabApple <- tabItem(tabName = "Apple", getQuote('AAPL')$Last) • tabGoogle <- tabItem(tabName = "Google", getQuote('GOOG')$Last) • tabs <- tabItems(tabApple,tabGoogle) • body <- dashboardBody(tabs) • ui <- dashboardPage(header, sidebar, body) • server <- function(input, output) {} • shinyApp(ui, server)
Sidebar • dashboardSidebar(..., disable =FALSE, width =NULL) • menuItem(text, ..., icon =NULL, badgeLabel =NULL, • badgeColor =“green", tabName =NULL, href =NULL, • newtab =TRUE, selected =NULL)
infobox • Display simple numeric or text values, with an icon • For a list of icons • http://fontawesome.io/icons/
Infobox • library(shiny) • library(shinydashboard) • library(quantmod) • header <- dashboardHeader(title = 'Apple stock watch') • sidebar <- dashboardSidebar() • infoLatest <- infoBox(title = 'Latest', icon('dollar'), getQuote('AAPL')$Last, color='red') • infoChange <- infoBox(title = 'Web site', icon('apple'),href='http://investor.apple.com', color='purple') • row <- fluidRow(width=4,infoLatest,infoChange) • body <- dashboardBody(row) • ui <- dashboardPage(header,sidebar,body) • server <- function(input, output) {} • shinyApp(ui, server)
infoBox(title, value =NULL, subtitle =NULL, • icon = shiny::icon("bar-chart"), color ="aqua", width =4, • href =NULL, fill =FALSE)
Dynamic dashboard • Server function • Write R code to be executed dynamically
Dynamic dashboard • library(shiny) • library(shinydashboard) • library(quantmod) • library(dygraphs) # graphic package for time series • header <- dashboardHeader(title = 'Apple stock watch') • sidebar <- dashboardSidebar(NULL) • boxPrice <- box(title='Closing share price', width = 12, height = NULL, dygraphOutput("apple")) • body <- dashboardBody(fluidRow(boxPrice)) • ui <- dashboardPage(header, sidebar, body) • server <- function(input, output) { • # quantmod retrieves closing price as a time series • output$apple <- renderDygraph({dygraph(Cl(getSymbols('AAPL', auto.assign=FALSE)))})} • shinyApp(ui, server) • Linkage between ui and server
Dynamic dashboard • Server function • Write R code to be executed dynamically • Use selection commands for dynamic choice
Dynamic dashboard • library(shiny) • library(shinydashboard) • library(quantmod) • library(dygraphs) • header <- dashboardHeader(title = 'Stock watch') • sidebar <- dashboardSidebar(NULL) • boxSymbol <- box(selectInput("symbol", "Equity:", choices = c("Apple" = "AAPL", "Ford" = "F", "Google" = "GOOG"), selected = 'AAPL')) • boxPrice <- box(title='Closing price', width = 12, height = NULL, dygraphOutput("chart")) • boxOutput <- box(textOutput("text")) • body <- dashboardBody(fluidRow(boxSymbol, boxOutput, boxPrice)) • ui <- dashboardPage(header, sidebar, body) • server <- function(input, output) { • output$text <- renderText({ • paste("Symbol is:",input$symbol) • }) • # Cl in quantmod retrieves closing price as a time series and graph • output$chart <- renderDygraph({dygraph(Cl(get(getSymbols(input$symbol, auto.assign=FALSE))))}) • } • shinyApp(ui, server) • Linkage between ui and server
Input options • http://rpackages.ianhowson.com/cran/shiny/
Skill builder • Using ClassicModels, build a dashboard to report total orders by value and number for a given year and month
Conclusion • shinydashboard has many options • Learn further from the documentation